About Dashboards
Dashboards combine metrics, logs, and trace data in one place to give you a complete picture of your environment. Use them to monitor infrastructure health, debug application issues, or track business metrics — all in a single view.
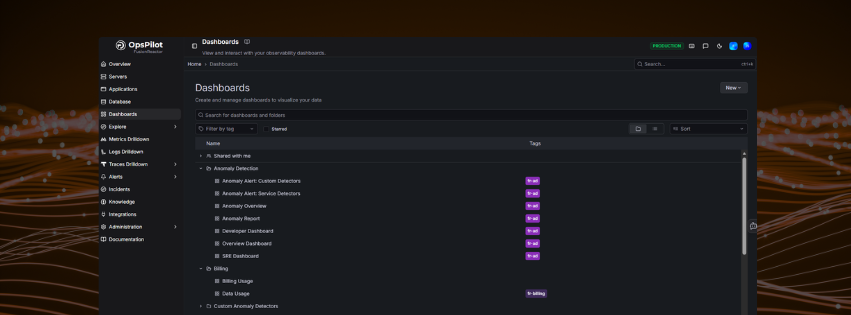
Navigate to Dashboards from the left-hand menu in OpsPilot to land on the Home dashboard.
The Home dashboard
The Home dashboard is your central hub for navigating all pre-built and custom dashboards. It is organised into sections — Metrics Dashboards, Logs Dashboards, Favorite Dashboards, and About Dashboards — so you can quickly find what you need.
Variable filters
At the top of the Home dashboard, dropdown filters let you scope all dashboards to a specific subset of your environment:
| Filter | Description |
|---|---|
| Job | Filter by job or service name |
| Application Name | Filter by application |
| Instance | Filter by individual instance |
Selecting a value applies it across the dashboards in each section. Click Clear Filters to reset all selections.
Category quick-links
A row of buttons lets you jump directly to dashboards by signal type or category:
| Button | Takes you to |
|---|---|
| Logs | Logs dashboards |
| Metrics | Metrics dashboards |
| Traces | Traces dashboards |
| Integrations | Integration dashboards |
| Kubernetes | Kubernetes dashboards |
| Anomaly Detection | Anomaly detection dashboards |
| Custom | Your custom dashboards |
Other actions
| Button | Description |
|---|---|
| Search Dashboards | Search across all dashboards by name |
| Create New Dashboard | Open the dashboard builder to create a new custom dashboard |
Dashboard sections
Metrics Dashboards
Pre-built dashboards for monitoring application and infrastructure metrics from the FusionReactor agent and OpenTelemetry.
| Dashboard | Description |
|---|---|
| Databases | Observe database activity including throughput, time, total queries and error rate, broken down by database, collection/table, and action. |
| Instance Map | Observe instance health based on process CPU, system CPU, or JVM memory usage. |
| Instances | Observe throughput, response time, and error count broken down per instance. |
| Request Performance | Observe throughput, response time, and error count broken down by application, transaction route, and status code. |
| Service Changes | Observe infrastructure-level service change events. |
| Span Metrics | Observe span-level metrics from distributed traces. |
| Status Codes | Observe HTTP status code breakdown across your applications. |
Logs Dashboards
| Dashboard | Description |
|---|---|
| FusionReactor Logs | View and filter logs shipped from the FusionReactor agent. |
| Log | General log browser for all ingested log data. |
| Log Browser | Browse and search logs with advanced filtering. |
| Log Errors | Focus view on error-level log entries. |
| Log Events | Observe log event volume and patterns over time. |
Traces Dashboards
| Dashboard | Description |
|---|---|
| Show Status Traces | View traces filtered by status code. |
| Show Traces | Browse all ingested trace data. |
| Trace Lookup | Look up a specific trace by ID or URL. |
Kubernetes Dashboards
| Dashboard | Description |
|---|---|
| Kubernetes / Compute Resources / Cluster | Observe CPU and memory usage across the entire cluster. |
| Kubernetes / Compute Resources / Pod | Observe CPU and memory usage broken down per pod. |
Integration Dashboards
| Dashboard | Description |
|---|---|
| ElasticSearch | Observe metrics from your ElasticSearch cluster. |
| IIS | Observe metrics from IIS web server. |
| Kafka | Observe metrics from the Kafka exporter. |
| MongoDB | Observe metrics from MongoDB. |
| MSSQL | Observe metrics from the MSSQL exporter. |
| MySQL | Observe metrics from the MySQL exporter. |
| NGINX | Observe metrics from the NGINX community exporter. |
| NGINX Pro | Observe metrics from the NGINX Pro exporter. |
| Node Exporter | Observe host-level metrics from the Node exporter. |
| OracleDB | Observe metrics from the OracleDB monitor. |
| Postgres | Observe metrics from the Postgres exporter. |
Billing Dashboards
| Dashboard | Description |
|---|---|
| Data Usage | Monitor your data ingestion usage against your plan limits. |
Experimental dashboards
Some dashboards are marked as experimental. This allows us to continually roll out new concepts before they are fully production-ready. These dashboards may contain issues as we continue to refine and develop them.
Info
Dashboards will continue to evolve — over time we will add new sets of dashboards and improve existing dashboards provisioned to your account.
Dashboard header controls
When viewing any individual dashboard, the header provides the following controls:
| Control | Description |
|---|---|
| Star icon | Add the dashboard to your Favourites |
| Make editable | Enable edit mode to modify the dashboard layout and panels |
| Export | Export the dashboard as a JSON file |
| Share | Share the dashboard — choose Share internally (share with other users in your organisation), Share externally (generate a public link), or Share snapshot (capture a static point-in-time snapshot) |
| Time picker | Set the time range for all panels (e.g. Last 1 hour) |
| Refresh | Manually refresh panel data, or set an auto-refresh interval |
Need more help?
Contact support in the chat bubble and let us know how we can assist.