Get Started with OpsPilot
OpsPilot, formerly FusionReactor Cloud, is an AI-powered observability and AI SRE platform. This guide walks you through creating your account, connecting your first data source, and exploring your initial views — from sign-up to your first insights in minutes.
Already have an account?
Sign in and head to your dashboard to start exploring your data. If you have an invitation, follow the link in your invitation email to access your organization.
Step 1 - Create your account
Navigate to app.opspilot.com/auth/register and sign up. Once signed in, you will be prompted to set up your organization.
Tip
Once signed in, you are prompted to define the name of your organization before proceeding to the dashboard.
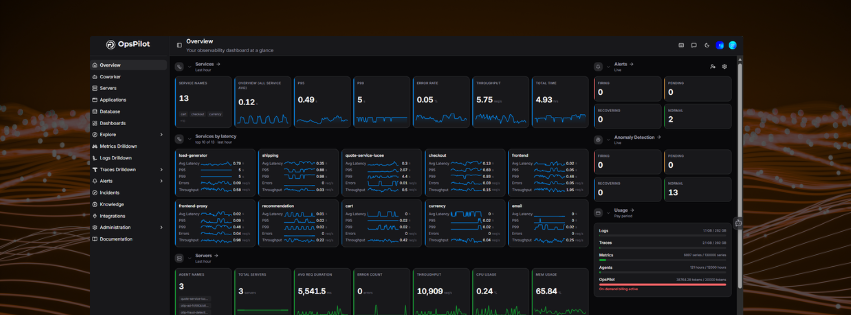
What you'll see first
When you first log in with no data connected, the Overview page displays a Get Started prompt in each section to guide you through setup.
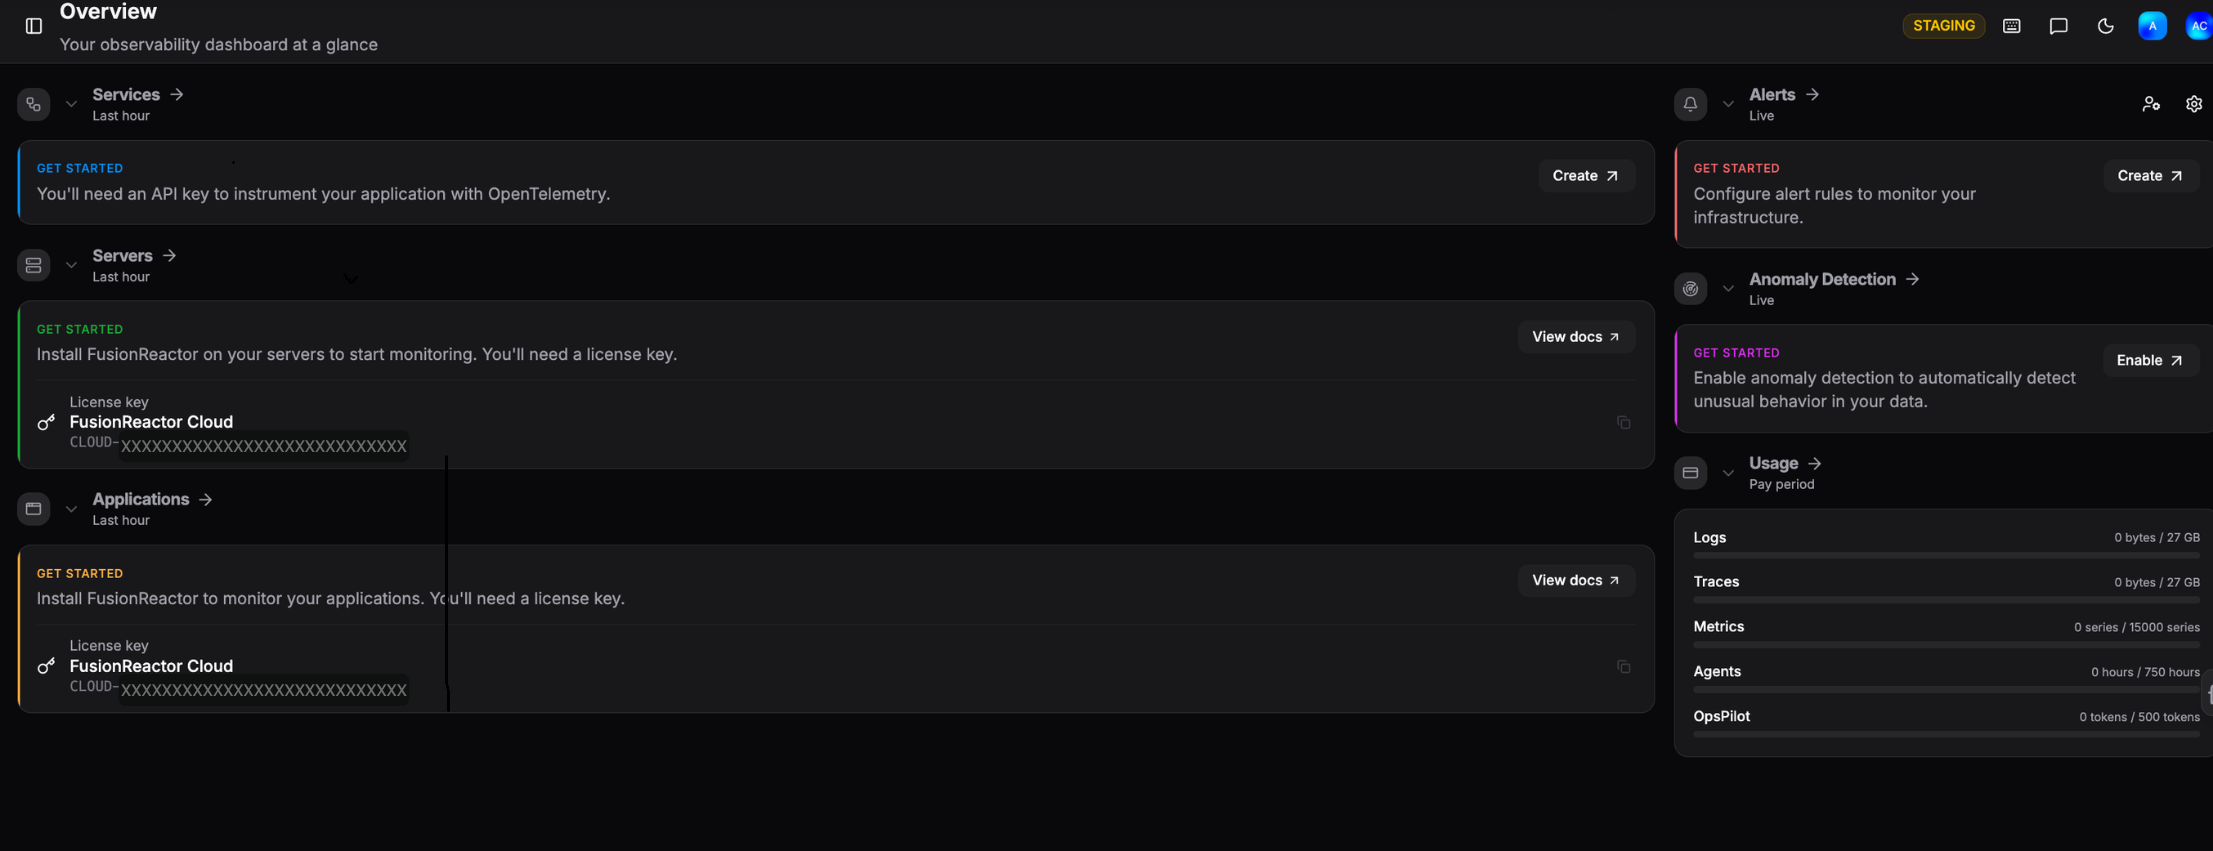
Each section tells you exactly what to install or configure to start seeing data.
Step 2 - Instrument your application
Send telemetry from your applications using OpenTelemetry or the FusionReactor agent.
Select your language:
Or deploy an OpenTelemetry Collector to receive and forward telemetry from your services.
Step 3 - Connect your infrastructure
Get metrics, logs, and traces flowing from your infrastructure using Grafana Alloy or standalone OpenTelemetry exporters.
| Signal | How to ship it |
|---|---|
| Metrics | Run an OTel-compatible exporter (e.g. Node Exporter, cAdvisor) and forward via Grafana Alloy or the OTel Collector |
| Logs | Use the Alloy loki.source component or the OTel filelog receiver to tail and forward log files |
| Traces | Configure your collector or Alloy pipeline to receive and forward spans to OpsPilot |
Grafana Alloy is a flexible, vendor-neutral collector that can scrape, transform, and forward all three signal types in a single agent.
Integration Hub - coming soon
A full self-serve Integration Hub with one-click setup for cloud providers, databases, Kubernetes, and more is on the way. Watch this space.
Step 4 - Query with AI
Once data is flowing, OpsPilot's AI works in two ways:
- Coworker - your AI SRE teammate that runs automated investigations in the background, surfaces prioritised insights, and flags issues before they escalate. Learn more
- OpsPilot Chat - ask questions in plain English to query your telemetry, investigate specific issues, or get on-demand AI analysis across metrics, logs, and traces.
Step 5 - Explore your data
Dive deeper into your data using the built-in drilldown tools.
| Where to look | What you'll find | Required integration |
|---|---|---|
| UI Overview | A tour of the OpsPilot interface | Any |
| Servers | Live and historic server health | FusionReactor agent |
| Applications | Request rates, errors, and latency | FusionReactor agent |
| Dashboards | Pre-built and custom visualizations | Any |
| Metrics Drilldown | Explore Prometheus metrics without PromQL | OpenTelemetry / Prometheus |
| Logs Drilldown | Filter and analyze logs without LogQL | OpenTelemetry / Loki |
| Traces Drilldown | Trace requests across services | OpenTelemetry |
| Alerts | Set up rules and get notified | Any |
Need more help?
Contact support in the chat bubble and let us know how we can assist.