Alert Rules
A well-configured alert rule is the difference between knowing about a problem before your users do and finding out from a support ticket. The Alert Rules page is where you build, manage, and investigate every alert rule in your environment - with a live view of what's firing, what's pending, and what's healthy, all in one place.
Navigate to Alerting > Alert Rules to open it.
Rules vs detectors
Rules are static checks - they run on a fixed schedule against fixed thresholds, best for known conditions with clear boundaries (like system CPU or allocated memory). Detectors use AI to learn normal behavior and flag anomalies automatically, so they adapt as your system changes.
Rules carried over from FusionReactor Alerts
Rules you created in FusionReactor Alerts were imported in their original format and work differently from rules built here - their condition sits inside the query rather than in a Threshold step. See Imported Rules to recognize one and to update it if you want to.
The rules list
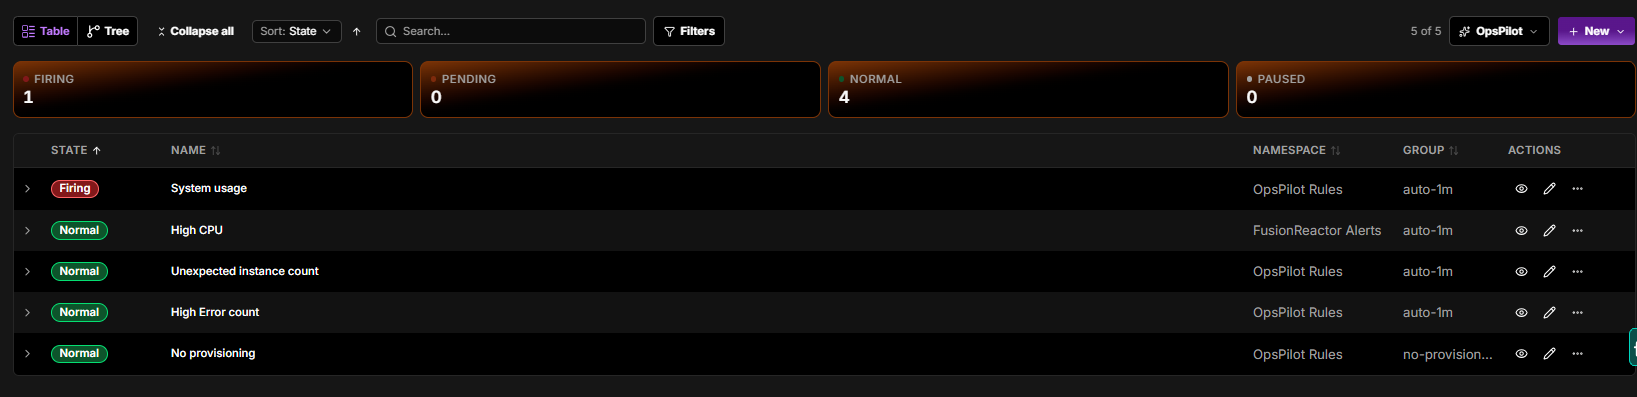
Four state counters sit above the list:
| State | Description |
|---|---|
| Firing | The alert condition is currently met |
| Pending | The condition is met but the pending period has not yet elapsed |
| Normal | The rule is evaluating and its condition is not met |
| Paused | The rule is paused and not being evaluated |
A state can carry a sub-reason, which appears in the rule's state history rather than in the counters - Normal (Missingseries), for example, means the rule returned no data because the query matched no series. The rule remains Normal, but flags that the data source returned nothing.
Views
Switch between Table and Tree view using the buttons in the toolbar:
- Table - a flat list of all rules with their state, namespace, and group
- Tree - rules grouped by namespace and evaluation group, useful for seeing how rules are organized
Use Collapse all to fold all groups at once in Tree view.
The right of the toolbar shows how many rules are listed (such as, 5 of 5), alongside a refresh button and the auto-refresh interval (such as, 30s).
The table has the following columns:
| Column | Description |
|---|---|
| State | Current state of the rule (Firing, Pending, Normal, Paused) |
| Name | The alert rule name |
| Namespace | The namespace the rule belongs to |
| Group | The evaluation group and its interval (such as, auto-1m) |
| Last evaluation | When the rule was last evaluated (such as, 29 Sept, 12:43) |
| Actions | A notification count, an Active toggle to enable or pause the rule, and buttons to view (eye), edit, and open more options |
The State, Name, Namespace, and Group headers are sortable - click one to order the list by it.
Expanding a rule
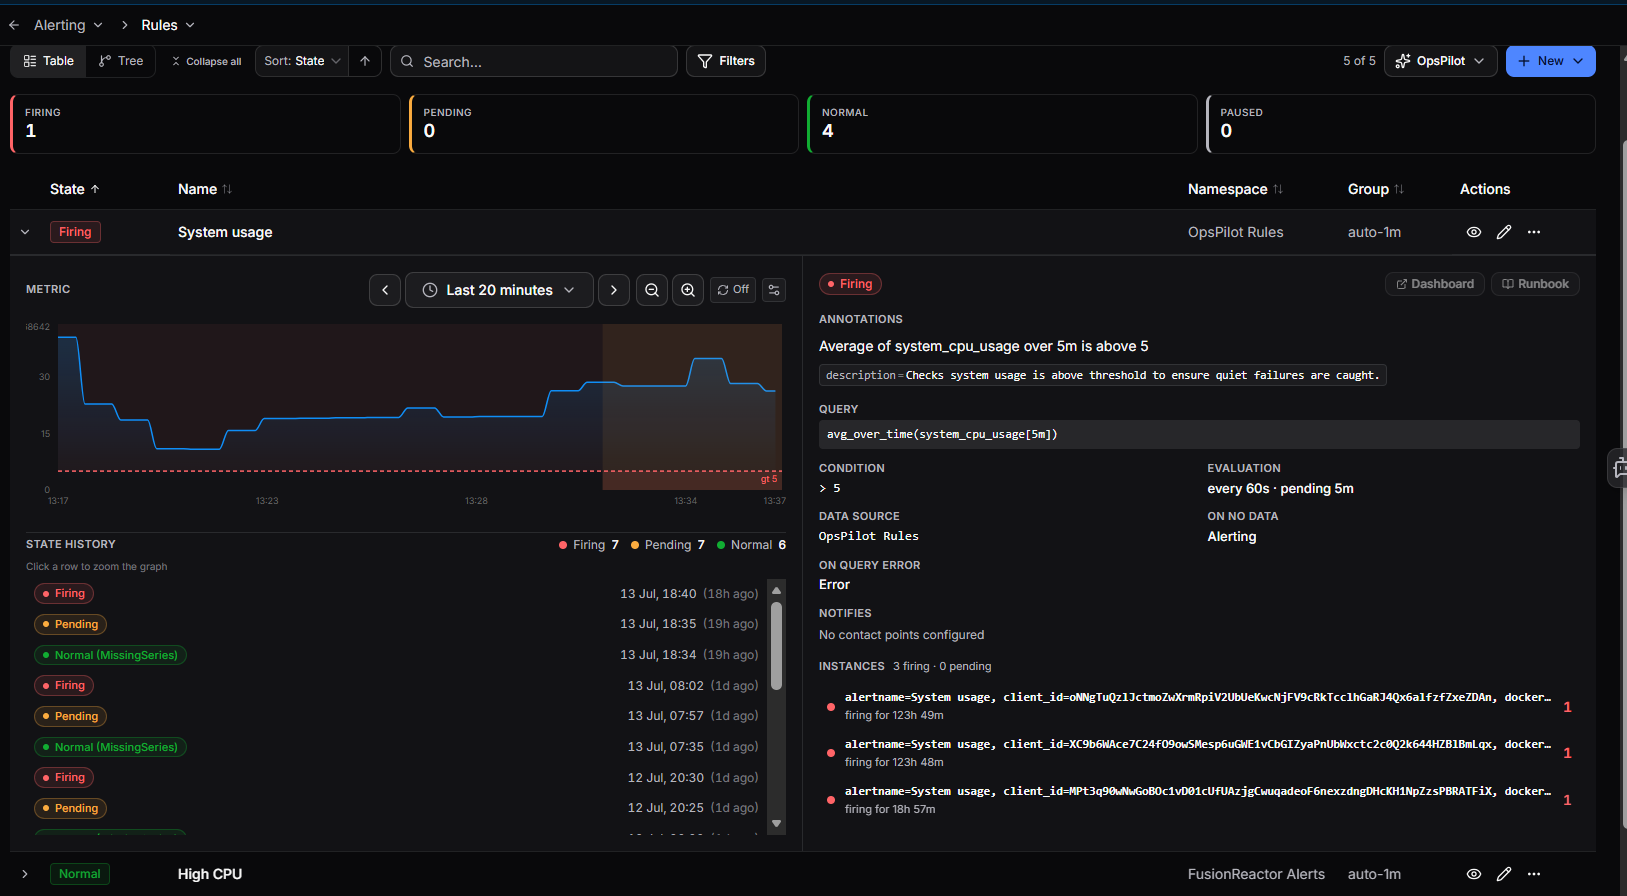
Click a rule row in the list to expand it in place. The left side shows:
- Metric - a live graph of the query with the threshold overlaid. Use the time range picker (with step arrows and zoom) to adjust the window
- State history - a log of state transitions with counts for Normal, Pending, and Error (rows may show sub-reasons such as Normal (Missingseries) or Pending (Error)). Click a row to zoom the graph to that moment
The Dashboard and Runbook buttons (top right of the expanded view) open the dashboard and runbook links from the rule's annotations. If the rule has no such annotation, the button reads No dashboard URL or No runbook URL and is inactive. The right side shows:
| Field | Description |
|---|---|
| Annotations | The annotations from the rule (such as its description) |
| Expression | The query and threshold condition as chained steps - for example, A max_over_time(up[5m]) feeding a C condition < 1 |
| Evaluation | How often the rule is checked and the pending duration (such as, every 60s · pending 5m) |
| Namespace | The namespace the rule is stored in |
| On no data | What state the rule enters when the query returns no data |
| On query error | What state the rule enters when the query fails |
| Labels | The rule's labels as name/value chips (such as, severity = warning) - these are what notification policies route on. Only shown when the rule has labels |
| Notifies | The contact points configured to receive notifications, each shown as a card with its name and type. Reads None configured when the rule has none |
| Instances | The matched instances with a firing/pending breakdown and a Firing only toggle. Each row shows the instance's labels, its state and when it last fired, and a Logs button to jump to its logs |
The rule panel
Clicking a rule on the Status page opens a panel beside the list - a quick look at that rule without leaving the page. Click the ✕ to close it.
The header shows the rule name, its state and how long it has held it, and the namespace and data source it belongs to (such as, FusionReactor Alerts / Metrics), with four actions:
| Action | Description |
|---|---|
| Silence | Create a silence for this rule |
| View rule | Open the full rule detail view |
| Edit rule | Open the rule editor |
| Active | A toggle to pause and resume evaluation |
Below the header sit two summary cards, Duration and State, then:
Metric - a graph of the query with the threshold drawn on it. Use the time range picker, its step arrows and the zoom buttons to adjust the window, or click Open in Explore to investigate the metric in Explore. Three checkboxes below the graph toggle the Threshold, State transitions and Pending window overlays.
State history - the rule's state changes, newest first. The header gives the period and transition count (such as, last 24h · 20 transitions), and See all → opens the full history. Each row reads as the new state from the previous one - for example, Pending from Normal - with when it happened, how long the previous state was held, and how long ago that was.
Rule detail view
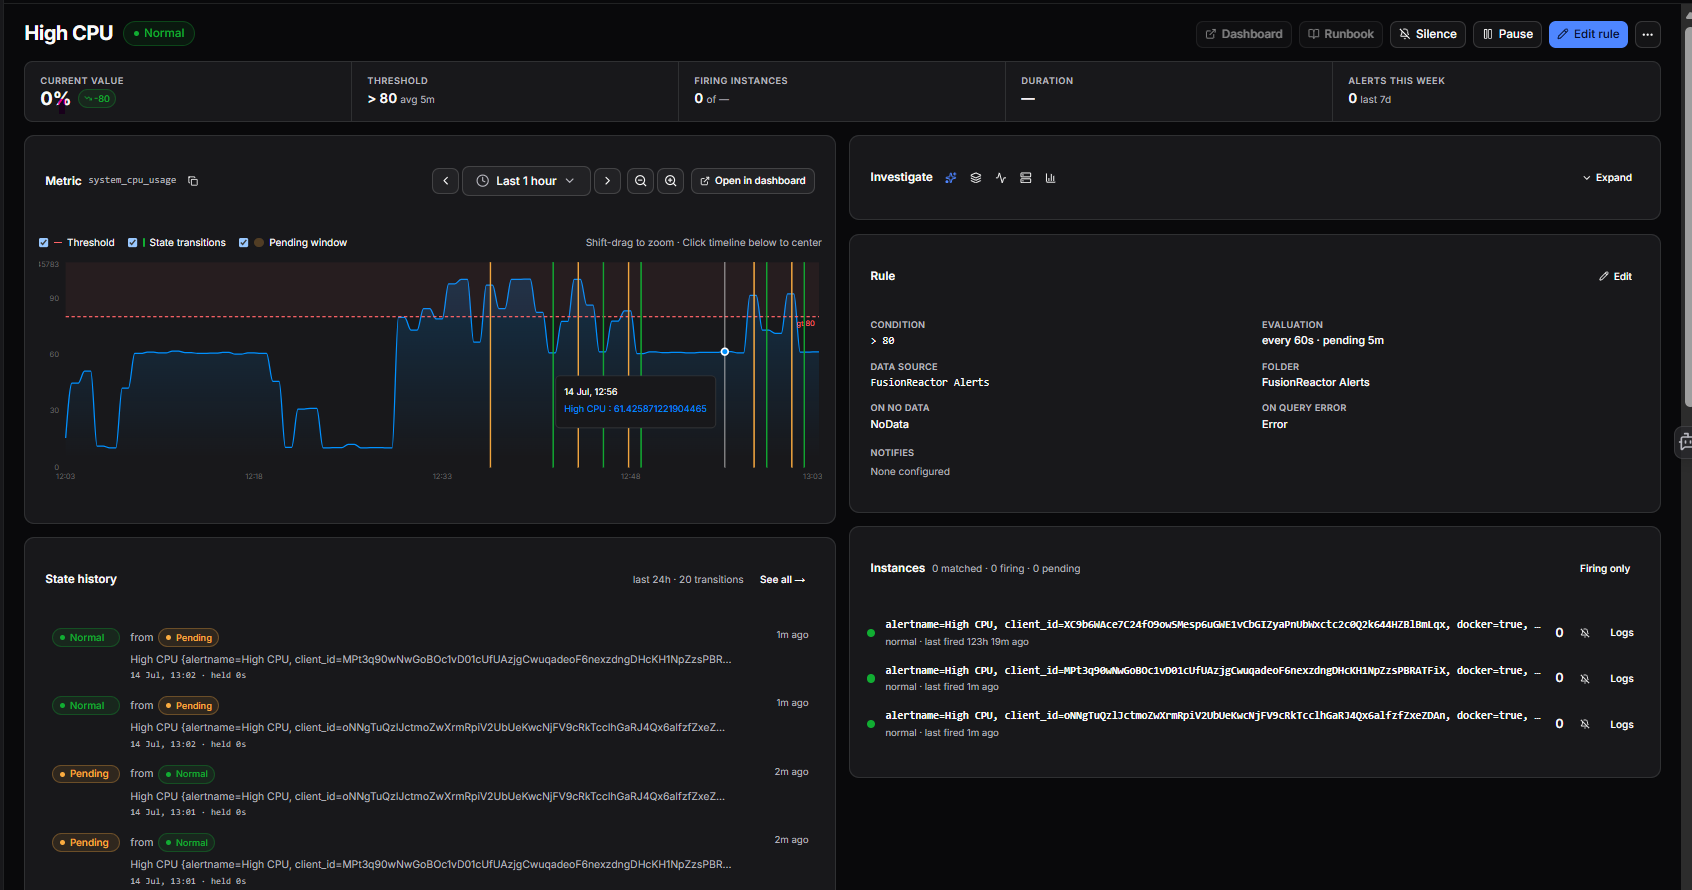
Open the full rule detail view by clicking the eye icon (View rule) in the rules list, or View rule in the rule panel. The header shows the rule name and current state, with these actions in the top right:
| Action | Description |
|---|---|
| Dashboard | Opens the dashboard linked in the rule's annotations |
| Runbook | Opens the runbook URL linked in the rule's annotations |
| Silence | Create a silence for this rule |
| Active | A toggle to pause and resume evaluation of the rule |
| Edit rule | Open the rule editor |
| ⋯ | More options |
A row of summary cards sits below the header:
| Card | Description |
|---|---|
| Current value | The latest query value, with the threshold shown alongside |
| Threshold | The condition and evaluation window (such as, > 80 avg 5m) |
| Firing alert instances | How many instances are firing out of the total (such as, 0 of 3) |
| Duration | How long the rule has been in its current state |
| Alerts this week | Count of alerts over the last 7 days |
Metric (left) - a live graph of the query, with the query itself shown in the panel header and a copy button beside it. Tick Threshold, State transitions, and Pending window below the graph to toggle those overlays. Use the time range picker (with step arrows and zoom) to adjust the window, shift-drag to zoom, or click the timeline to center. Click Open in Explore to investigate the metric in Explore.
State history (left, below the graph) - a log of state transitions showing the change (such as, Normal (Missingseries) from Pending (Error)), when it happened, and how long the previous state was held. The header shows the period and transition count (such as, last 24h · 12 transitions); click See all for the full history.
Rule (right) - the rule's configuration, with the dashboard and runbook buttons repeated at the top:
| Field | Description |
|---|---|
| Annotations | The annotations from the rule (such as its description) |
| Expression | The query and threshold condition as chained steps - a Query step (with its data source) feeding a Threshold step |
| Evaluation | How often the rule is checked and the pending duration (such as, every 60s · pending 5m) |
| Namespace | The namespace the rule is stored in |
| On no data | What state the rule enters when the query returns no data |
| On query error | What state the rule enters when the query fails |
| Notifies | The contact points configured to receive notifications |
Alert instances (right, below Rule) - a count of matched, firing, and pending instances, with a list of all current instances and their labels. Toggle Firing only to hide healthy instances, and click Logs on any instance to view its logs.
Sorting and filtering
- Sort - order rules by State, Name, or other fields. Toggle ascending/descending with the arrow button
- Search - find rules by name
- Filters - All namespaces and All groups dropdowns narrow the list to a single namespace or evaluation group
- Hide anomaly detectors - toggle on to show only static rules and hide anomaly detectors from the list
OpsPilot
Writing good alert rules is hard - thresholds that are too sensitive create noise, too lenient and real problems slip through. Click the OpsPilot button to get AI-assisted help directly in context:
| Option | Description |
|---|---|
| Help me make a rule | Guides you through creating a new alert rule |
| Help me set up notifications | Helps configure contact points and routing |
| Explain my firing alerts | Explains what your currently firing alerts mean |
| Suggest alert thresholds | Recommends threshold values based on your data |
Creating an alert rule
A good alert rule has three things: a query that targets the right signal, a threshold that fires at the right level, and a routing label that gets the notification to the right person.
Click + New rule (top right) to open the rule editor. (To create an anomaly detector instead, see Service or Custom Anomaly Detectors, or use the Wizard on the Status page.)
The guided wizard
Starting a rule from the Wizard on the Status page walks you through the decisions one at a time, rather than presenting the whole form at once. A row of dots below the heading tracks your progress through the steps.
You are never locked into the wizard. Each step offers:
| Control | What it does |
|---|---|
| ← | Go back to the previous step |
| Skip to form | Leave the wizard and go straight to the main rule form |
| Not sure? Ask OpsPilot | Get a recommendation for the step you're on |
| ✕ | Close the wizard without creating anything |
Skip to form is offered on every step but the last, where Skip and Done take its place.
The steps are:
What are you monitoring? - pick the data source the alert will query. The list holds every data source configured on your account, including those added by integrations, so an AWS installation appears here alongside your metrics and logs sources.
How do you want to build the query? - choose how to express the condition:
| Option | Description |
|---|---|
| Guided builder | Build your query step by step |
| Write PromQL | Write the query expression directly |
This choice is not binding - you can switch between the two later in the form.
What should we watch? - pick the metric, or write the query, that the alert will evaluate. What this step shows depends on the choice you made at the previous one:
- Guided builder gives you a Metric dropdown. Once you choose a metric, a preview graph appears below it showing that metric's recent behavior, so you can confirm you have the right signal before going further.
- Write PromQL gives you a PromQL expression box to type the query into directly.
Either way, click Next to continue. The wizard is the same length whichever you pick.
When should it fire? - set the threshold that triggers notifications:
| Field | Description |
|---|---|
| Alert when value is | Above or Below the threshold |
| Threshold | The value to compare against (such as, 80) |
| Wait before alerting | How long the condition must hold before the alert fires - 1m, 5m, or 10m |
Wait before alerting is the pending period under a plainer name. Leaving it at anything above 1m is what stops a brief spike from paging someone.
Who gets notified? - pick one or more contact points with + Add contact point. This step is optional: click Skip to create the rule without notifications and add them later, or Done to finish.
A rule with no contact point still evaluates and still shows its state on Status - it just won't notify anyone. Its expanded view reads None configured under Notifies.
Note
The earlier steps advance as soon as you pick an option. From What should we watch? onward, you make a choice and then click Next.
Rule editor modes
The rule editor has two modes, toggled in the top right:
| Mode | Description |
|---|---|
| Quick | A streamlined single-page form for common metric alerts |
| Advanced | The full editor with every option (folder and evaluation group, no-data and error handling, muting/grouping/timings, and the full notification message) |
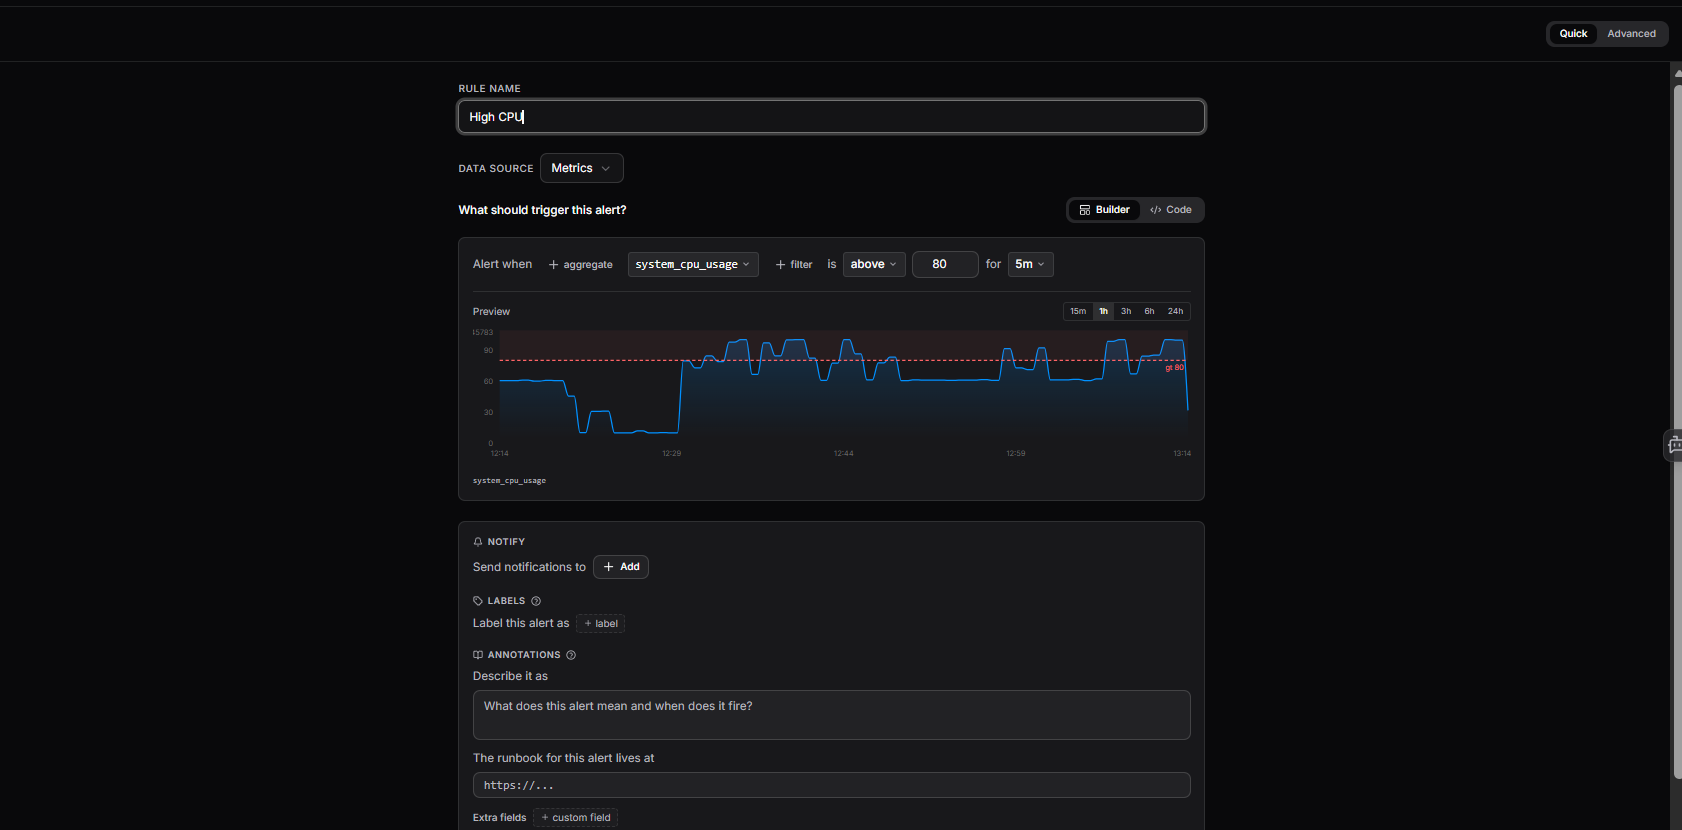
Quick mode
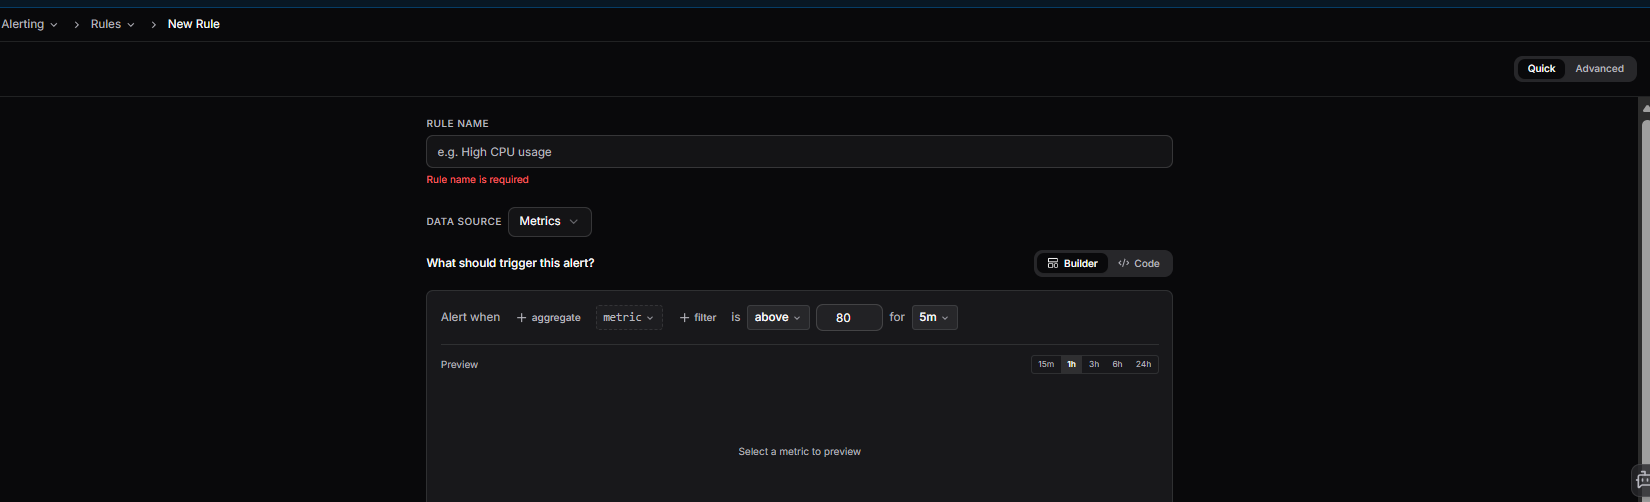
Quick mode puts the essentials on one page:
- Rule name - the alert's name (becomes the
alertnamelabel) - Data source - the data source to query (such as, Metrics)
- What should trigger this alert? - build the condition in Builder mode (Alert when [metric] is [above / below] [value] for [duration], with optional aggregate and filter), or switch to Code to write the query directly. A Preview graph shows the threshold against recent data, with 15m/1h/3h/6h/24h range buttons
- Notify - click + Add contact point to choose where notifications are sent
- Labels - click + Add label to add routing labels
- Annotations - describe what the alert means, set the runbook URL, and add extra custom fields
- When data is missing - choose the state to use when no data is received (for example, No Data)
Advanced mode
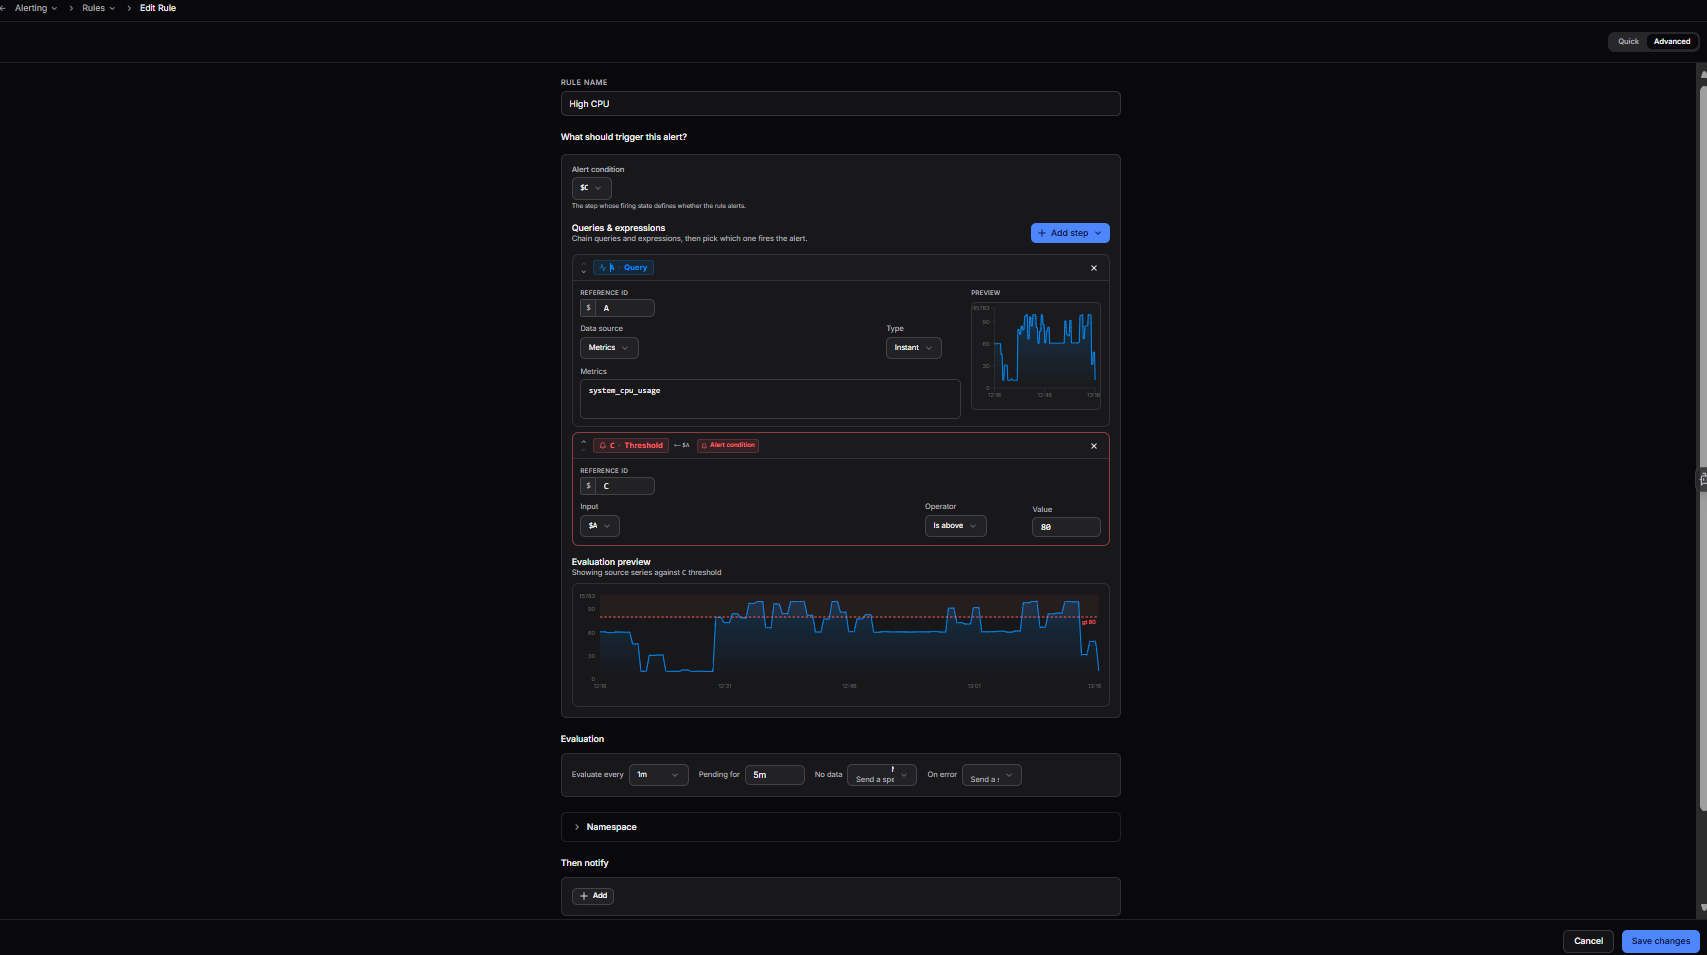
Advanced mode is a single-page form that exposes the full configuration - chained queries and expressions, a dedicated alert condition, and complete evaluation, routing, and annotation settings. Its sections, top to bottom, are below.
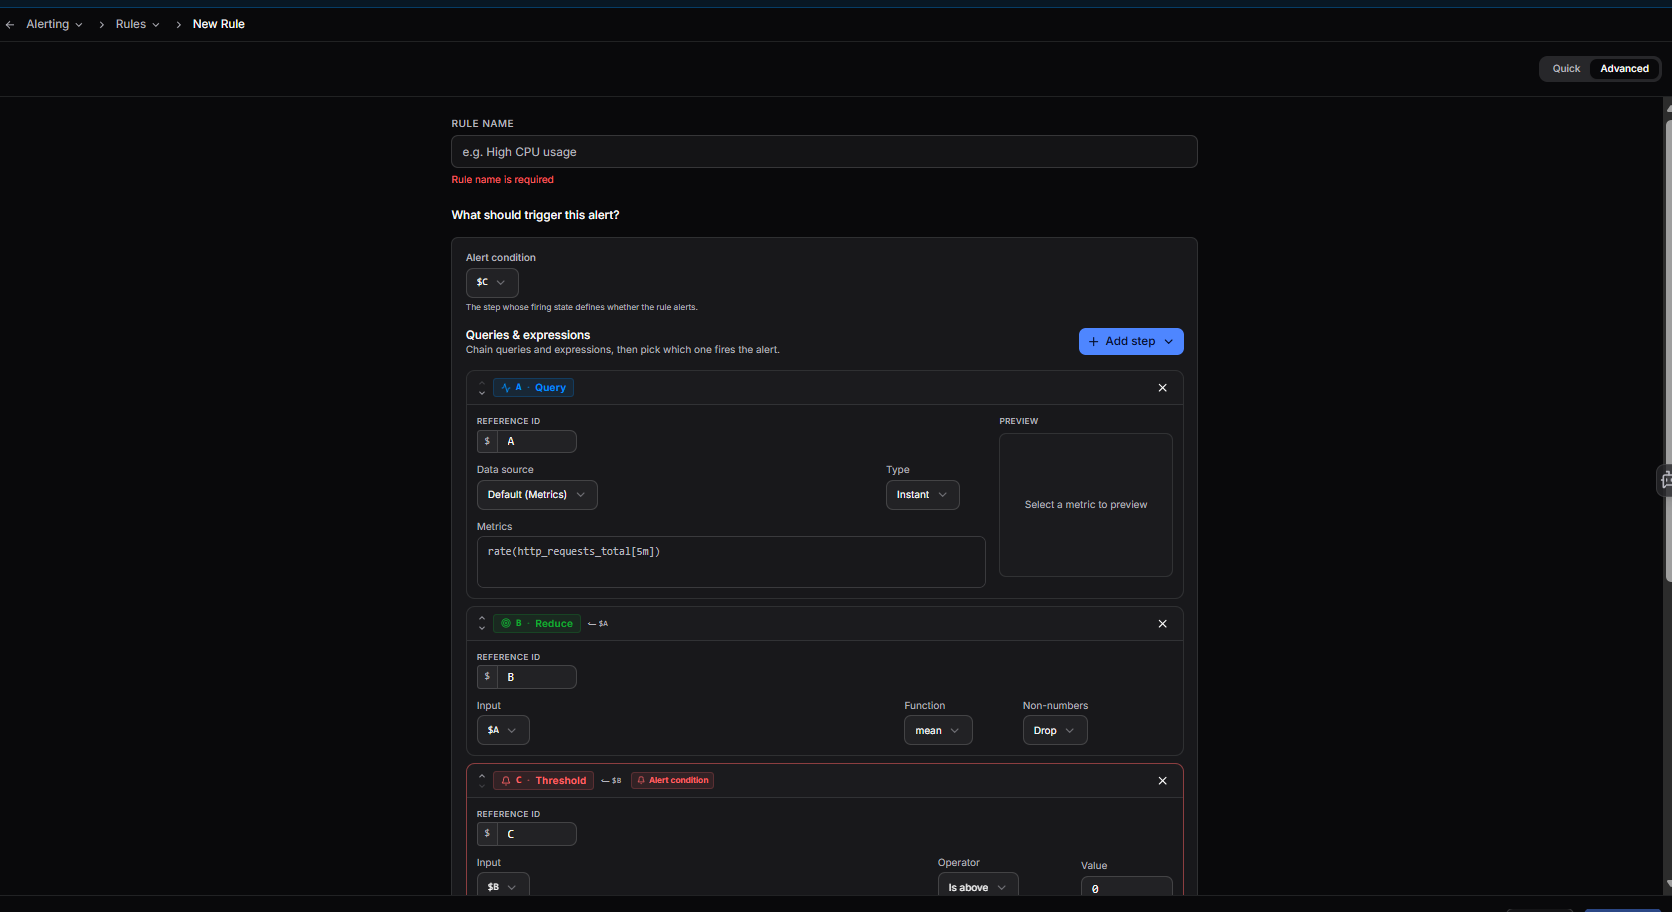
What should trigger this alert?
Build the alert from a chain of Queries & expressions. Click Add query (or use its dropdown) to add a step; each step has a reference ID (such as $query) that later steps can reference. The available step types are:
| Step | Category | Description |
|---|---|---|
| Query | Data | Query metrics or logs - pick a Data source and Type, enter the query, and use the Preview graph |
| Math | Expression | Compose a formula with $referenceId values |
| Reduce | Expression | Reduce a series to a single scalar value - choose an Input, a Function (such as mean), and how to handle non-numbers |
| Resample | Expression | Realign a series by a time window |
| Threshold | Expression | Compare an Input against a value using an Operator (such as is above) |
| Complex conditions | Expression | Combine multiple conditions with AND/OR |
A new rule starts with a default Query → Reduce → Threshold chain. The Alert condition dropdown at the top selects which step's firing state determines whether the rule alerts.
Each step is labeled with a chip naming its reference ID and type, colored by category, and steps that take input from another show which one they follow (such as, ← $reduce). The step serving as the alert condition is outlined and carries an Alert condition badge, so you can see at a glance which one decides the outcome.
Reorder steps with the arrows to the left of each one, and remove a step with the ✕ on its right.
Below the chain, Evaluation preview runs the pipeline through the alert condition step and shows the result as it would be evaluated. If a step cannot run, the preview reports the failure and names the step responsible - an empty or malformed query, for example, reads Couldn't evaluate this rule. Use it to catch mistakes before saving rather than after the rule goes live.
Evaluation
The Evaluation section controls how the rule runs:
| Setting | Description |
|---|---|
| Group | The evaluation group the rule belongs to (such as, default) |
| Every | How often the rule is checked (such as, 1m). The schedule belongs to the group rather than to the individual rule |
| Pending for | How long the condition must be continuously met before the alert fires (such as, 5m). Prevents notifications for temporary spikes |
| No data | The state the rule enters when the query returns no data - No Data, Alerting, Normal, or Keep last state |
| On error | The state the rule enters when the query fails - Error, Alerting, Normal, or Keep last state |
Tick Choose the group and schedule myself to set the group and its interval by hand. Rules in a group all evaluate together on one schedule, so changing it changes every rule in that group - not only the one you are editing.
Namespace
Expand Namespace and choose the namespace where the rule is stored. Namespaces keep rules organized and control access.
Rule name
Enter a descriptive, unique Rule name. It appears in notifications, and automatically becomes the alertname label on every alert instance the rule produces.
Then notify
Under Then notify, click + Add contact point to choose where notifications are sent. Search your existing contact points by name, or click Create new contact point to make one without leaving the rule - see Contact Points for the integration types and their fields.
Labels
Expand Labels and click + Add label to add routing labels. Labels control how alerts reach contact points via notification policies - for example, a channel label:
| Label | Value | Routes to |
|---|---|---|
channel |
email |
Email contact point |
channel |
slack |
Slack contact point |
channel |
webhook |
Webhook contact point |
Learn more
Annotations
Expand Annotations to describe the alert:
| Field | Purpose |
|---|---|
| Description | What the alert means and when it fires |
| Runbook URL | A link to your runbook or incident response guide |
Click + Add annotation to add more annotation fields.
Annotations and labels support Go template strings, so an alert can report the value that fired it, the labels on the series, and the threshold it crossed - and word itself differently depending on any of them. See Annotation Templates.
Save
Click Save rule to activate the rule. It begins evaluating on its next scheduled interval.
Editing a rule
Click Edit rule on a rule's detail view to reopen the rule editor with all of its current settings pre-filled. Editing uses the same Quick and Advanced modes as creating a rule, so you can adjust the query, threshold, labels, or notifications and click Save changes.
Quick mode:
Advanced mode:
Pausing a rule
Use the Active toggle in the Actions column of any rule in the list to pause evaluation without deleting it. The toggle switches to Paused, and the rule's State column shows Paused with no Last evaluation time. While paused, the rule stops evaluating and no new alert instances are created. Existing firing instances remain in their last state until evaluation resumes.
Alert rule limits
| Plan | Maximum rules |
|---|---|
| Free | 100 |
| Paid | 2,000 (soft limit) |