Service Detail
The Service Detail page gives you a deep breakdown of a single service's performance, errors, log patterns, and active alerts. You can arrive here by clicking a service name in the Services Overview, which pre-selects that service automatically. The selected service appears as a filter chip at the top of the page. Click the x to clear it and return to an unfiltered view, or use the Select Service dropdown to switch services. Use the time range selector to adjust the period.
The page is split into three tabs: Detail, Traces, and Logs.
Detail tab
Performance charts
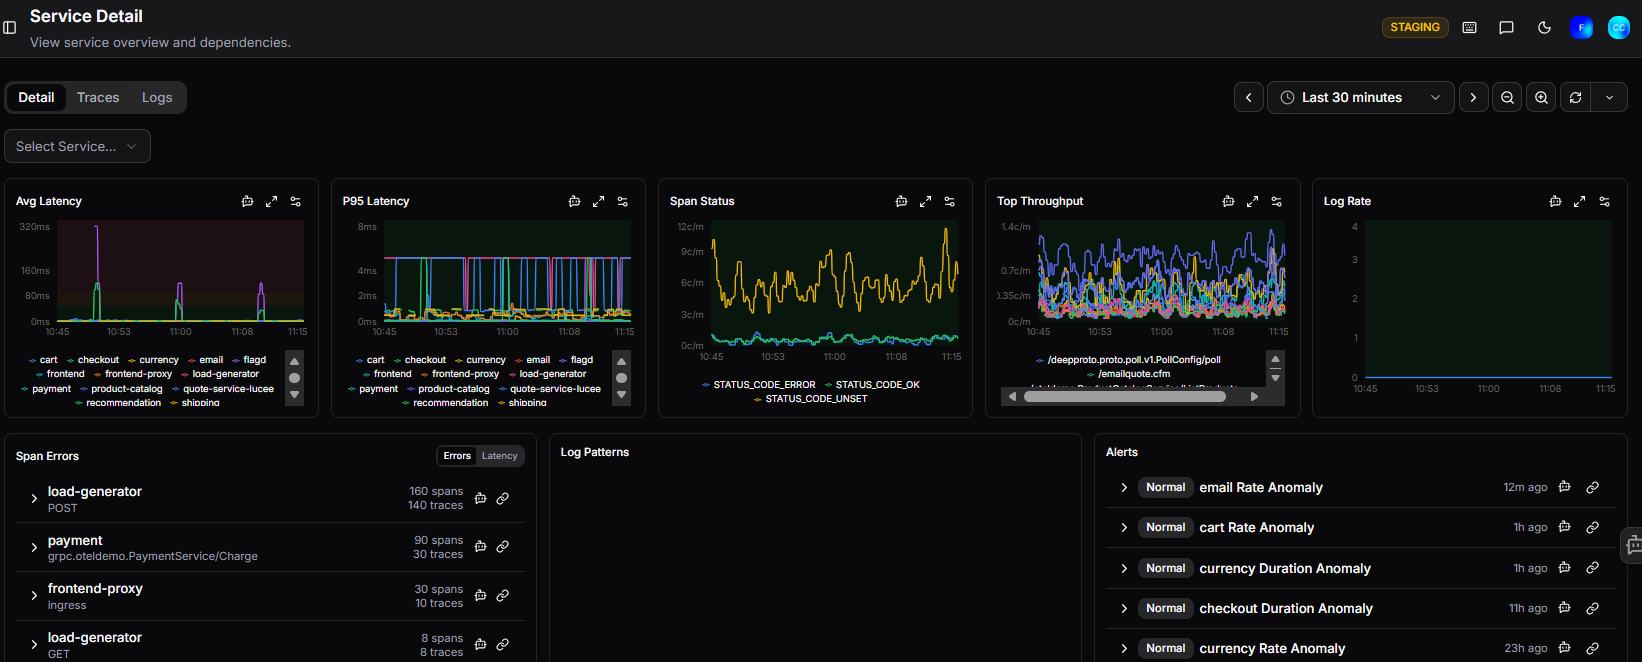
At the top, five charts give you an at-a-glance view of the service's health:
| Chart | Description |
|---|---|
| Avg Latency | Average response time across all requests, broken down by operation |
| P95 Latency | 95th percentile latency, highlighting worst-case response times |
| Span Status | Breakdown of span outcomes: STATUS_CODE_ERROR, STATUS_CODE_OK, STATUS_CODE_UNSET |
| Top Throughput | Request rate by endpoint, showing which operations are busiest |
| Log Rate | Volume of log output over time |
Each chart can be expanded to full screen using the expand icon in the top right corner.
Span Errors
The Span Errors table lists the operations generating the most errors or highest latency. Toggle between Errors and Latency views using the buttons above the table.
Each row shows:
- Service and operation name
- Span count: total spans recorded
- Trace count: number of traces the spans belong to
Use the trace icon to open a trace directly, or the link icon to copy a direct link.
Log Patterns
The Log Patterns section surfaces recurring patterns in log output. If no patterns are detected in the selected time range, it displays a "No patterns detected in the current time range" message.
Alerts
The Alerts section shows all alert rules associated with the selected service, along with their current state and time since last change. Alerts are listed with their status (Normal, Firing, or NoData) and name, giving you a quick view of whether anything is currently triggering. If no alerts are configured for the selected service, it displays "No alerts match the selected services".
Need more help?
Contact support in the chat bubble and let us know how we can assist.