Logs
The Logs tab allows you to view, filter, and analyze the log messages generated by the specific server instance in real time. This is essential for debugging errors and understanding system events.
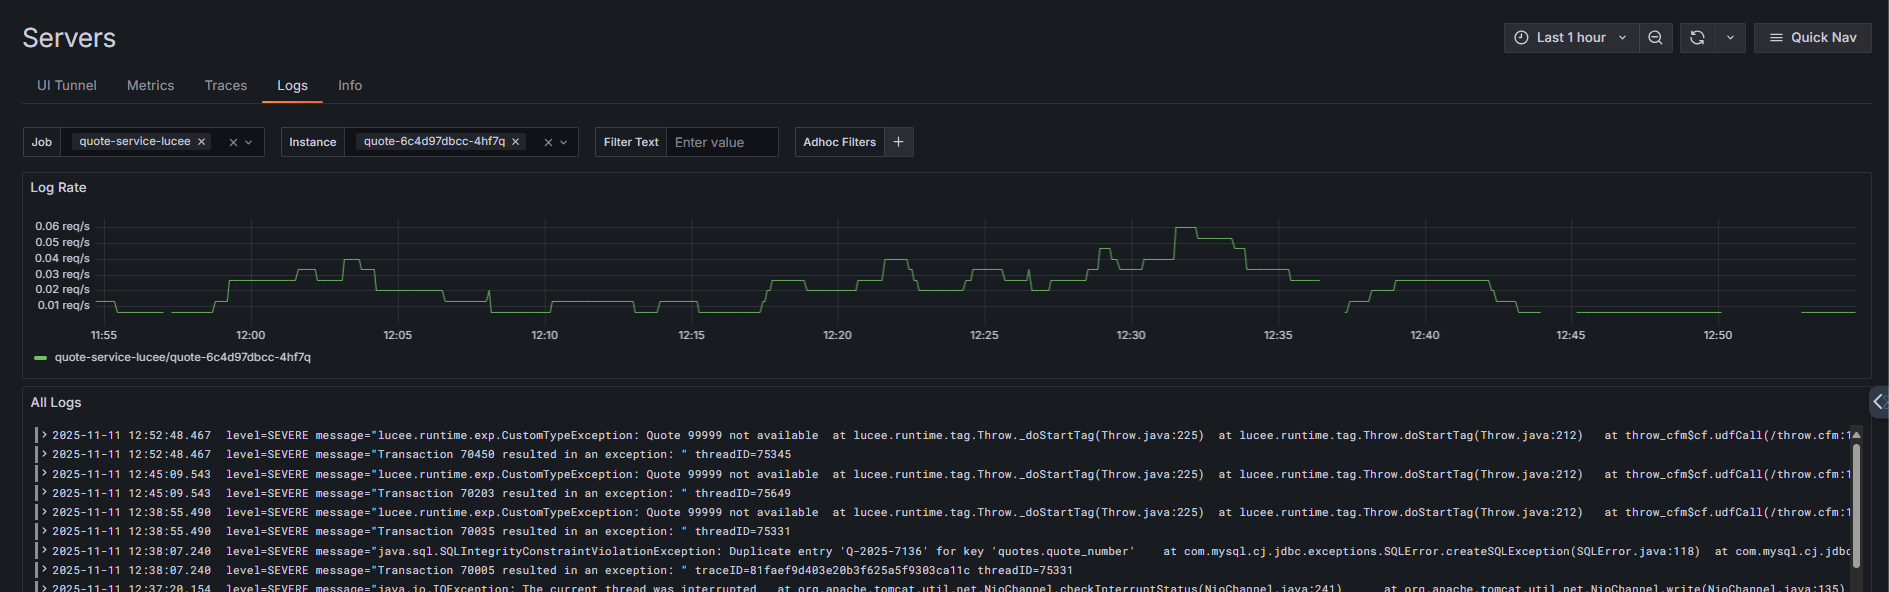
Log Rate graph
The top graph displays the volume of log entries over time, measured in requests per second (req/s). This visualization helps you:
- Identify spikes in logging activity that may indicate issues.
- Correlate log volume with performance problems or errors.
- Understand normal logging patterns for your services.
Filtering logs
Use the filter bar to narrow down log entries:
- Job - Filter by service or application name (e.g., quote-service-lucee).
- Instance - Select a specific container or server instance (e.g., quote-6c4d97dbcc-4hf7q).
- Filter Text - Search for specific keywords, error messages, or patterns within log content.
- Adhoc Filters - Add custom filters with the + button to refine results further.
Filters work together to help you quickly locate relevant log entries in high-volume environments.
Log stream
The All Logs section displays individual log entries in chronological order. Each entry shows:
- Timestamp - Exact date and time the log was generated (YYYY-MM-DD HH:MM:SS.mmm format).
- Level - Log severity (e.g., SEVERE, WARNING, INFO, DEBUG).
- Message - The complete log message, including stack traces for errors.
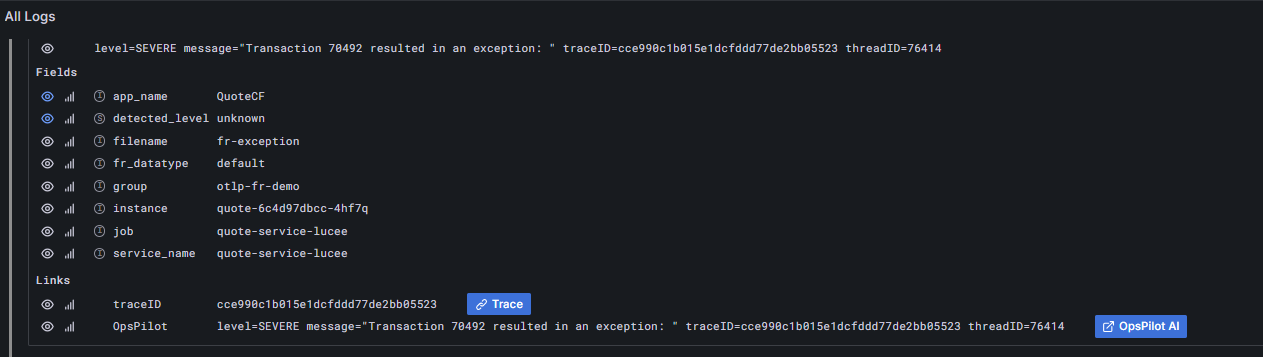
Log details
When you click the arrow next to a log entry, it expands to show three sections:
-
Log Line - The complete, raw log message exactly as written by the application. This includes the timestamp, severity level (e.g., SEVERE), and the full message text with any error details or stack traces.
-
Fields - Structured metadata about the log entry, including the application name, service, instance ID, source file, and environment. Each field has icons that let you toggle visibility, view statistics, or add it as a filter.
-
Links - Quick actions to explore related data:
- Trace button - Opens the associated distributed trace to see the full request flow that generated this log
- Ask OpsPilot AI button - Sends the log to OpsPilot for AI-powered analysis, explanations, and troubleshooting recommendations
Need more help?
Contact support in the chat bubble and let us know how we can assist.