Incidents
When something breaks, the last thing your team needs is to fight its tools. Incidents pulls the whole response onto one page - declaration, coordination, communication, and post-mortem - so your team spends less time figuring out what to do and more time fixing the problem.
Declare an incident the moment you know something is wrong, fill in what you know, and update the details as the situation develops. Everyone involved sees the same picture in real time.
The incidents list
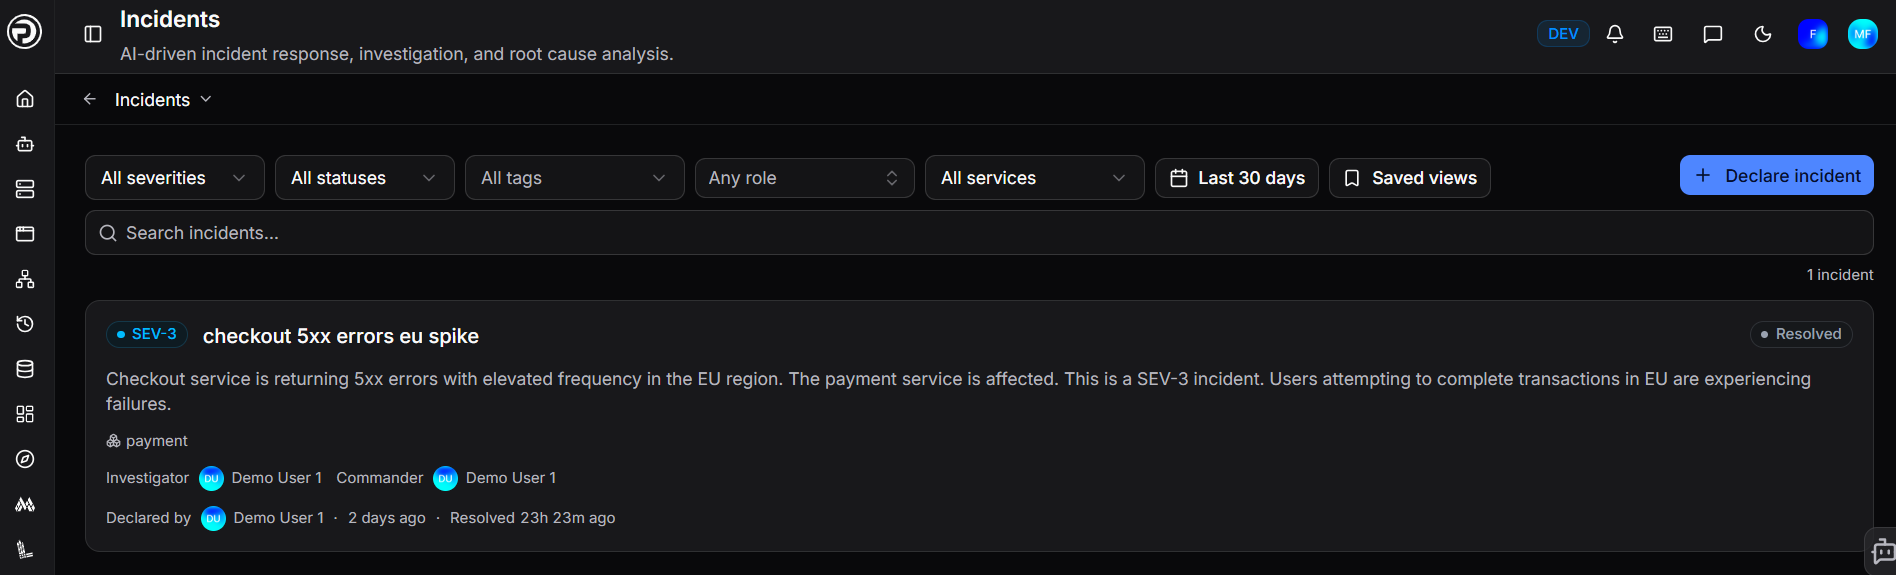
The Incidents page shows all incidents across your organisation. Use the filters at the top to narrow the list:
| Filter | Description |
|---|---|
| All severities | Filter by SEV-1, SEV-2, SEV-3, or SEV-4 |
| All statuses | Filter by lifecycle status (Triage, Investigating, Mitigated, Resolved) |
| All tags | Filter by tag |
| Any role | Show only incidents where you hold a specific role |
| All services | Filter by affected service |
| Date range | Adjust the time window (default: last 30 days) |
Use Saved views to bookmark a filter combination for quick access. Use the search bar to find incidents by keyword.
Each incident card shows the severity badge, title, description, affected services, assigned roles, and how long ago it was declared.
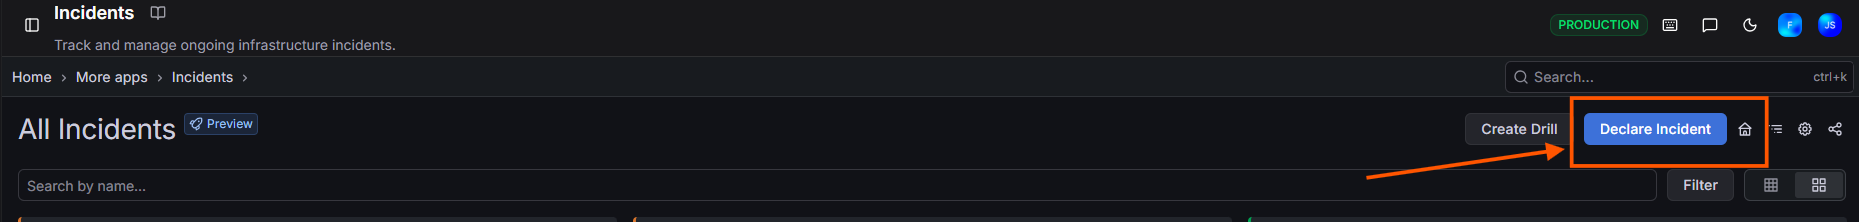
Declaring an incident
Click + Declare incident to open the declaration form. Fill in what you know - every field except Title can be updated as the situation develops.
| Field | Description |
|---|---|
| Title | A brief description of the incident |
| Severity | SEV-1 through SEV-4 (see Severities) |
| Investigator | The person leading the technical investigation (optional) |
| Commander | The person coordinating the overall response (optional) |
| Services | The catalog services affected (optional) |
| Tags | Free-text tags for categorisation - press Enter or comma to add (optional) |
| Description | Any context observers should know upfront (optional) |
Click Declare to create the incident.
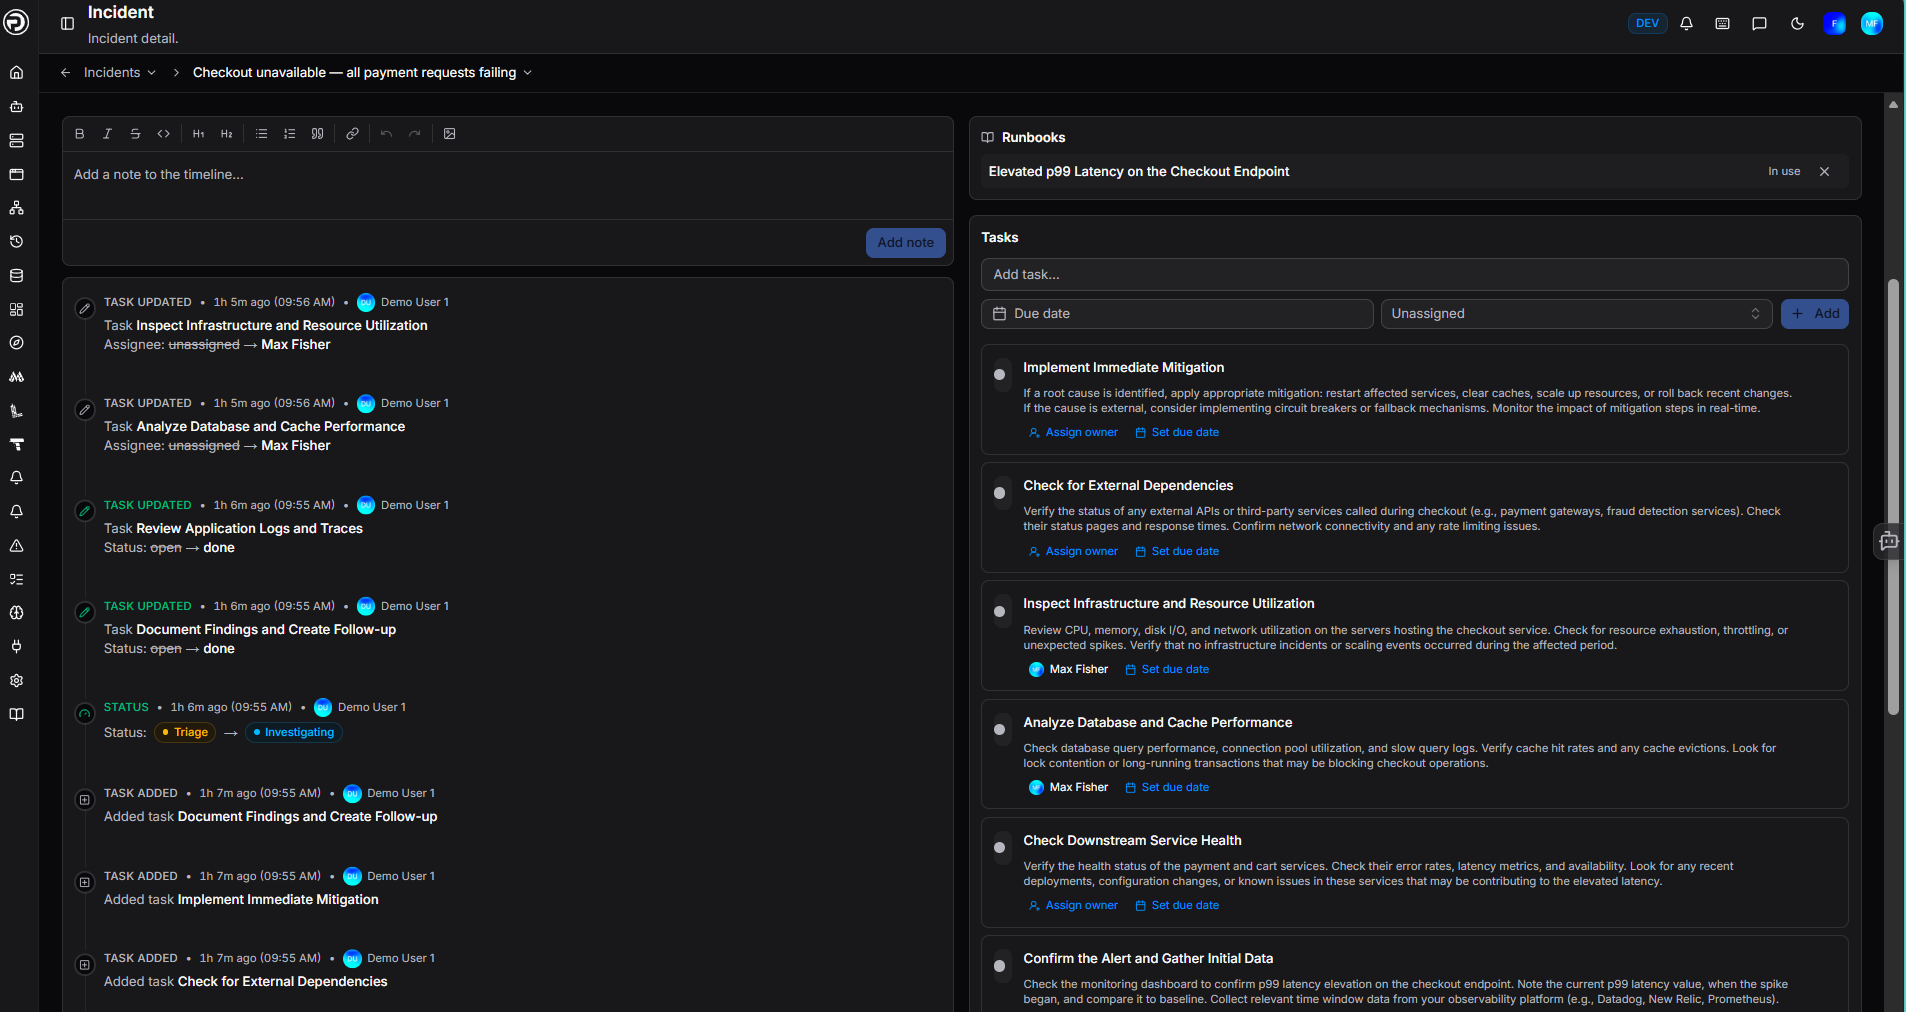
The incident detail view
Clicking an incident opens the full detail view.
Lifecycle
A progress bar at the top shows the incident's current stage:
Triage → Respond → Resolve → Closed
Each stage records a timestamp when first entered, giving you an honest record of how long each phase took. If SLA targets are configured for the incident's severity, the bar shows at a glance whether you are on track or slipping - so there are no surprises when you review response times later. See Configuring incidents to set SLA targets per severity.
Activity
The Activity tab is the live timeline for the incident. Use the rich text editor to add notes - you can format text, add links, and attach screenshots. Click Add note to post to the timeline.
Status changes are logged automatically. The result is a complete, shared record of what happened and when - useful for post-incident review, stakeholder updates, and ensuring nothing gets lost in side channels like Slack or email.
Scope
The Scope tab lets you link related or duplicate incidents together. Linking incidents helps you spot when a single underlying cause is generating multiple reports, and keeps the full picture in one place rather than spread across separate threads. Search for an incident by name, select the relationship type, and click Link.
Post-mortem
The Post-mortem tab is where you write up the incident once it is resolved. Click Choose a starting point to select one of your post-mortem templates or start from a blank page. Write in Markdown using the built-in editor, then export to PDF, Markdown, or HTML when done.
Sidebar
The right-hand sidebar on every incident gives quick access to the key details:
Roles
Shows the current Commander and Investigator. Click the settings icon to add or change role assignments.
Status
Shows the current severity, status, affected services, and tags - all editable inline without leaving the incident.
Tasks
Add tasks directly to the incident with an optional due date and assignee. Tasks created here also appear on the Tasks board alongside your other work.
Runbooks
Any runbooks that match the incident's affected services and severity surface automatically in the sidebar. Click a runbook to expand it, or convert its steps into tasks in one click.
Severities
Four severities are available by default:
| Severity | Typical use |
|---|---|
| SEV-1 | Critical - major impact, immediate response required |
| SEV-2 | High - significant impact, urgent response needed |
| SEV-3 | Medium - moderate impact, timely response required |
| SEV-4 | Low - minor impact, standard response |
Severities are fully customisable - you can rename, reorder, delete, and add your own in Administration > Preferences > Incidents. To use incidents for practice drills, add a custom severity called Drill (or similar) to make test incidents clearly identifiable.
Configuring incidents
All incident configuration lives in Administration > Preferences > Incidents.
Statuses
Statuses represent the lifecycle stages an incident moves through. The four defaults are Triage, Investigating, Mitigated, and Resolved. Each status can carry one or more flags that drive analytics and lifecycle tracking:
| Flag | Effect |
|---|---|
| ack | Stamps the acknowledged timestamp when this status is first entered - used for MTTA calculation |
| mitigated | Stamps the mitigated timestamp - used for MTTM calculation |
| terminal | Closes the incident when this status is reached |
Add custom statuses with their own labels, slugs, colours, and flags to match your team's process.
Roles
Investigator and Commander are built-in and cannot be removed. Add custom roles - for example, Comms lead or Scribe - for any additional responsibilities your response process needs.
Severities
Edit the default severities or add your own. For each severity you can:
- Set an SLA budget with time targets for acknowledging, mitigating, and publishing a post-mortem
- Toggle the post-mortem gate, which blocks an incident from reaching a terminal status until its post-mortem is published (on by default)
Need more help?
Contact support in the chat bubble and let us know how we can assist.