Traces Drilldown
Trace requests across services to find bottlenecks.
Navigate to Traces Drilldown from the left-hand sidebar to explore distributed trace data without writing TraceQL queries.
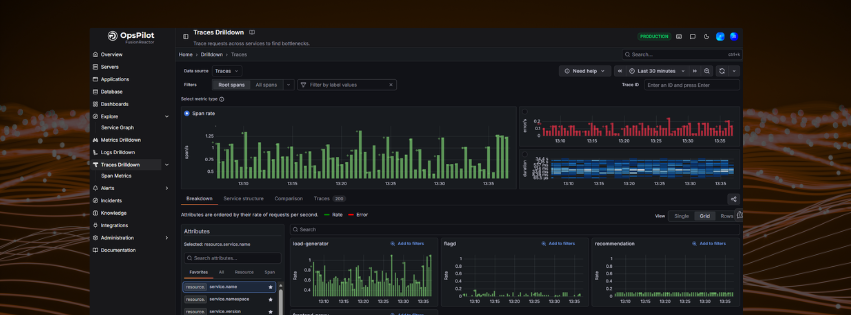
Filters
| Filter | Description |
|---|---|
| Data source | Select the Traces data source |
| Root spans / All spans | Toggle between root-level spans only or all spans |
| Filter by label values | Narrow traces by attribute values |
| Trace ID | Look up a specific trace by ID |
| Time range | Set the time window using the picker in the top right. Use « / » to step the range backwards and forwards, the zoom out icon to widen it, and the refresh icon to reload |
Click Need help (top right) to open guided tips and links to documentation.
Metric type
Select the metric type to drive your investigation:
- Span rate - requests per second across services
- Errors - error rate over time
- Duration - latency distribution across spans
The main graph updates to show the selected metric over the chosen time range.
Tabs
Click the Share icon (right of the tab row) to generate a link to the current view.
Breakdown
The default view. Shows how the selected metric breaks down across attribute values.
- Attributes panel (left) - browse and search attributes by category: Favorites, All, Resource, Span
- Common attributes include
resource.service.name,resource.service.namespace,k8s.pod.name,span.name,span.status,http.status_code - Click Add to filters on any service card to scope the view
- Switch between Single, Grid, and Rows view modes
- Attributes are ordered by rate of requests per second, with error rate overlaid in red
Service structure
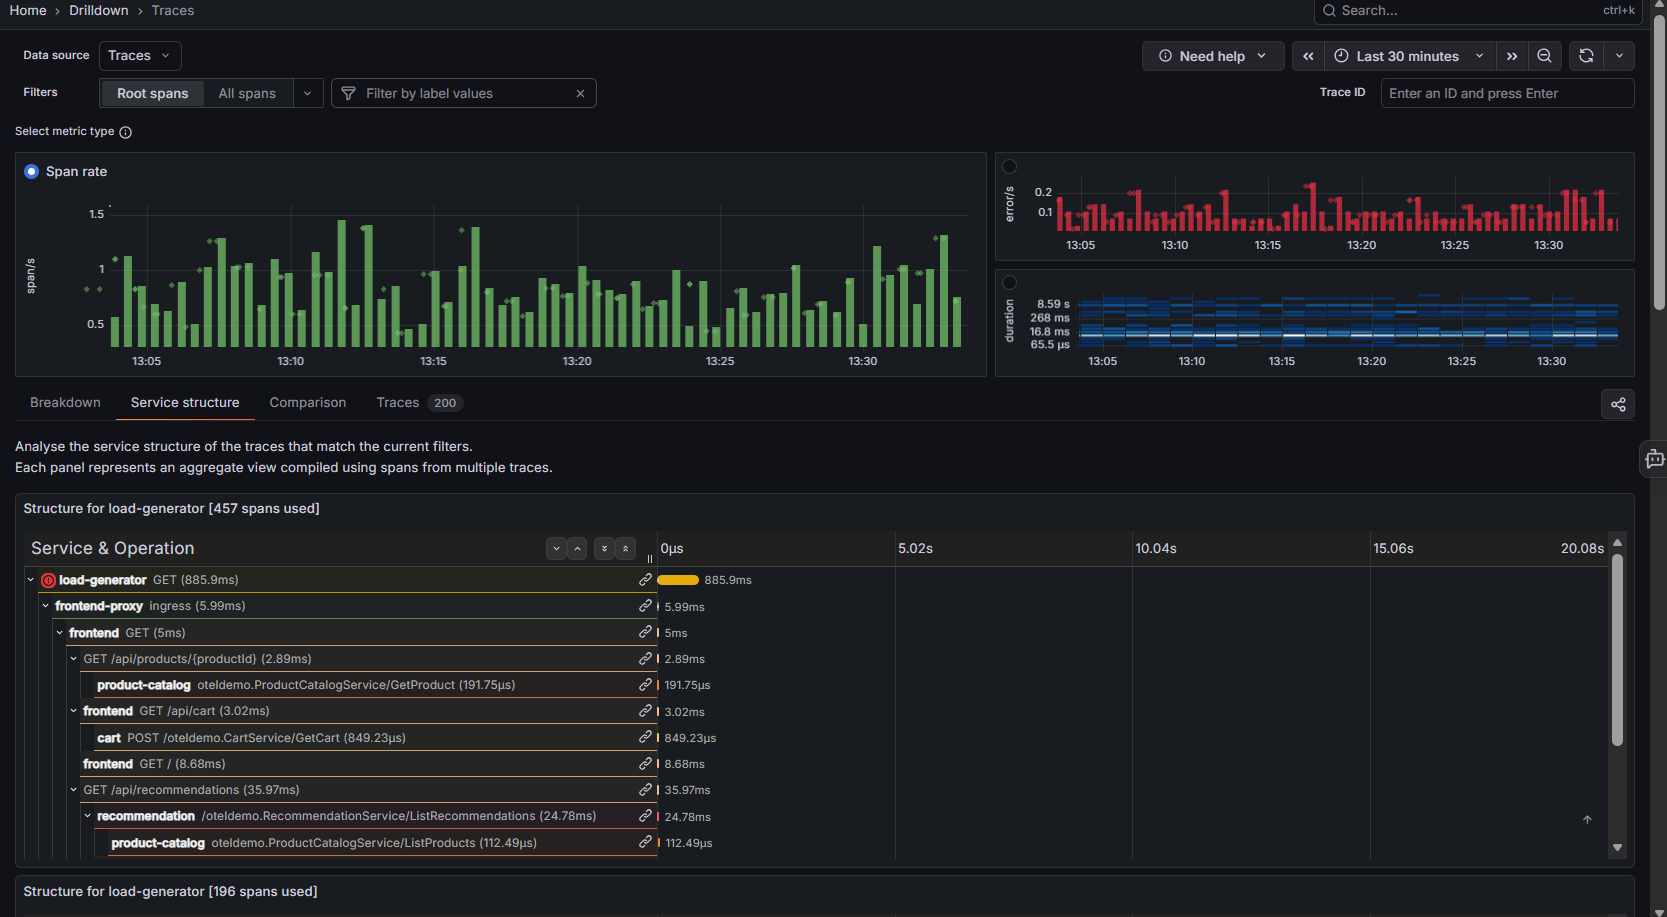
Analyses the service structure of the traces that match the current filters. Each panel is an aggregate view compiled using spans from multiple traces, with a header showing how many spans were used (e.g., Structure for load-generator [457 spans used]).
Each panel shows a Service & Operation tree alongside a duration timeline:
- Rows are nested to show the call hierarchy (service, operation, and duration for each span).
- Use the expand/collapse controls to open or close branches of the tree.
- Errors are flagged with a red indicator on the affected span.
Comparison
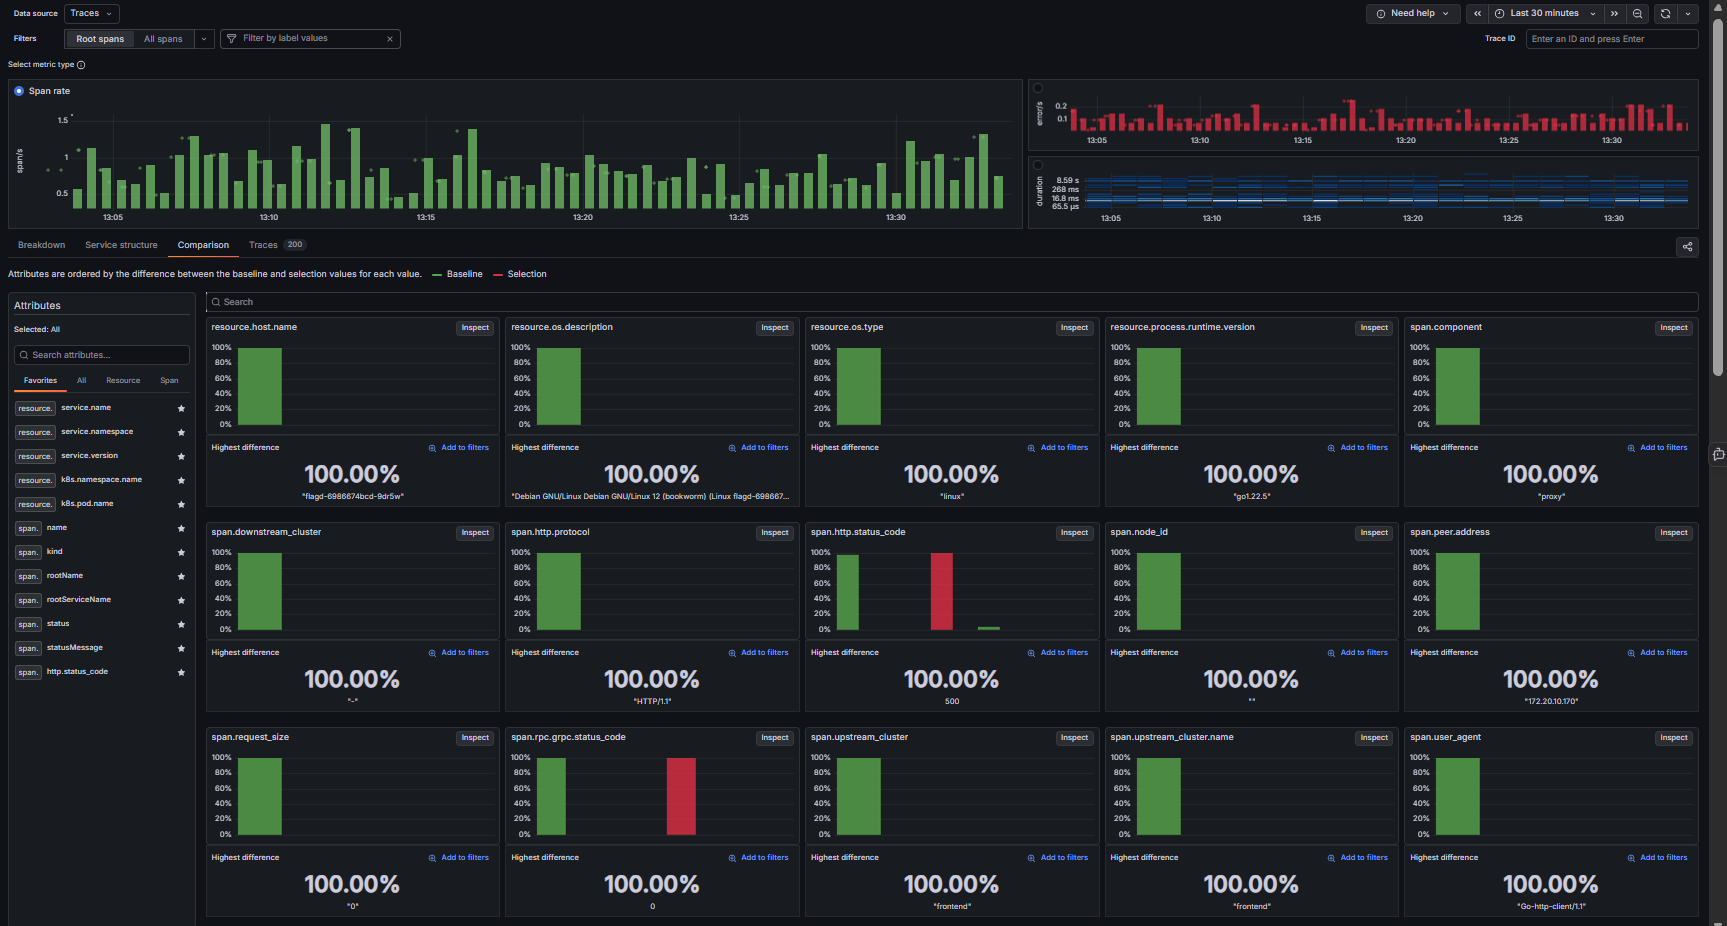
Compares a Baseline (green) against a Selection (red) to surface which attributes differ most between the two. Attributes are ordered by the difference between the baseline and selection values for each value.
- The Attributes panel (left) lets you browse and search attributes by category: Favorites, All, Resource, Span.
- Each attribute panel shows the value distribution and the Highest difference (e.g., 100.00%) for that attribute.
- Click Inspect to look at an attribute in more detail, or Add to filters to scope the view by it.
Traces
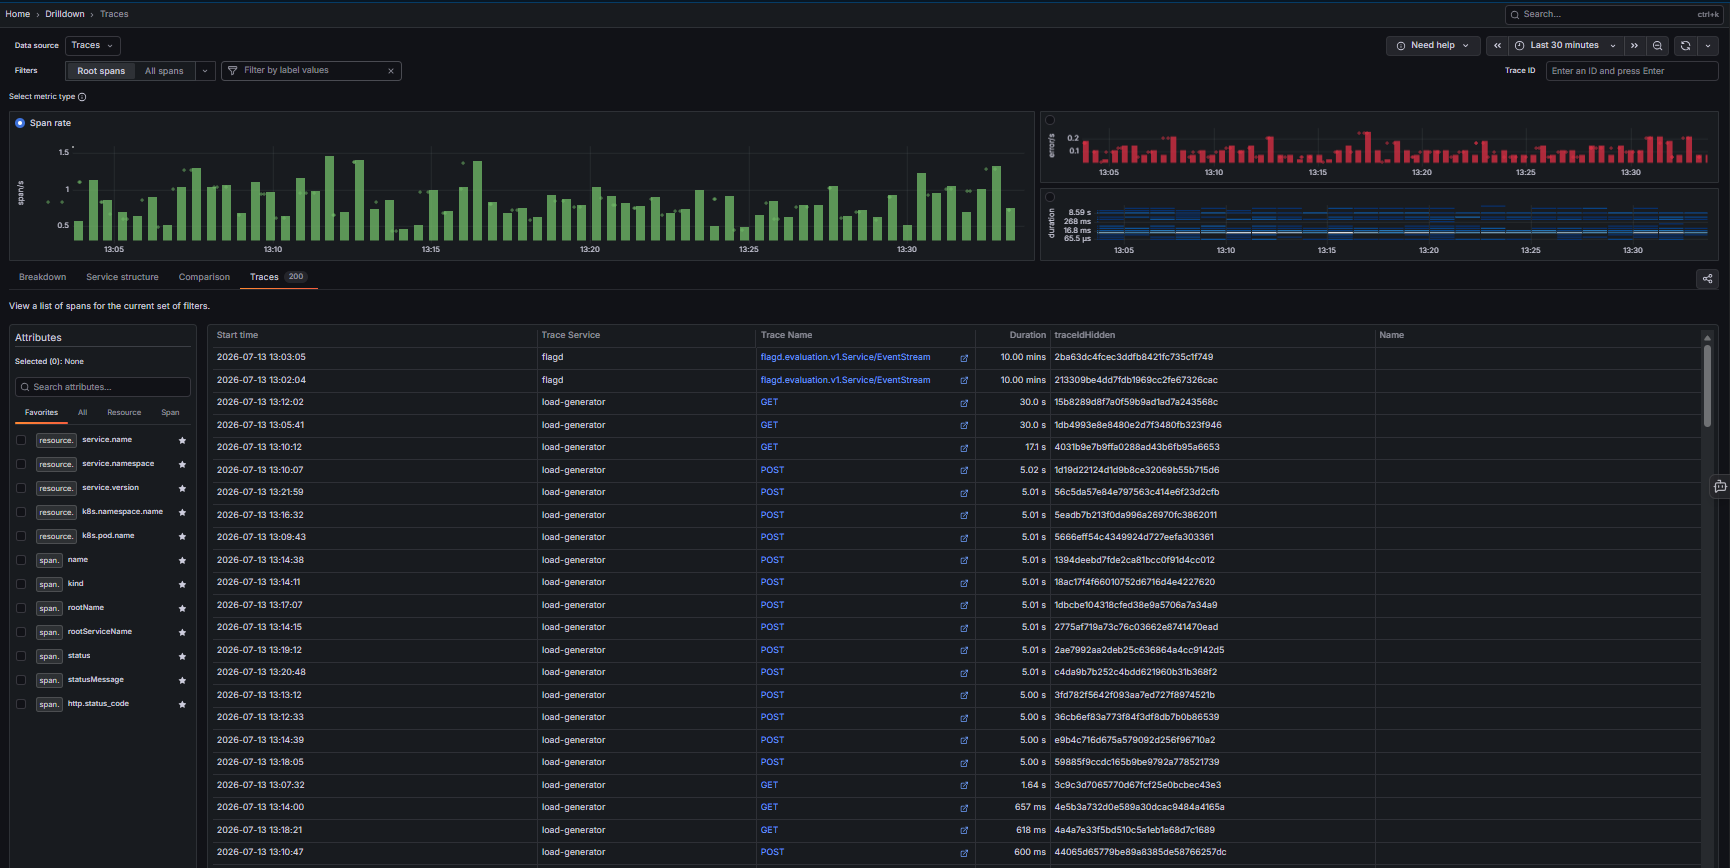
A table of individual traces (spans) for the current set of filters, showing up to 200 results. Columns include Start time, Trace Service, Trace Name, and Duration.
- Click a Trace Name link (external-link icon) to open the full trace detail view.
- Use the Attributes panel (left) to select attributes and refine the list.
Trace detail view
Clicking a Trace Name link opens a detail panel showing the full trace waterfall. The panel header shows the trace's root service and operation, with Analyze Trace and Share buttons in the top right.
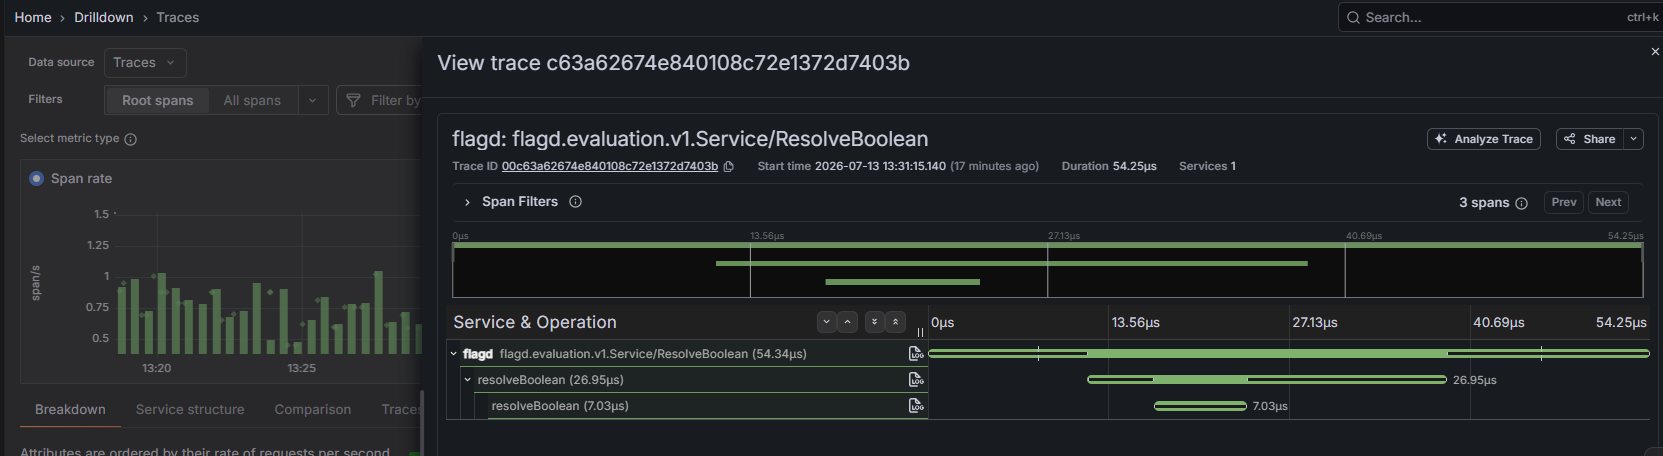
| Field | Description |
|---|---|
| Trace ID | Unique identifier for the trace (click to copy) |
| Start time | When the trace began |
| Duration | Total end-to-end time for the trace |
| Services | Number of services involved |
| URL | The request URL that triggered the trace (if available) |
Span waterfall
The waterfall view shows each span as a horizontal bar, positioned on a timeline from 0 to the total trace duration. Each row shows the service name, operation, and duration, and a Logs button to view logs related to that span.
Use Span Filters to narrow the spans shown, and Prev / Next to step through them. The total span count is shown above the waterfall (e.g., 3 spans).
Analyze Trace
Click Analyze Trace in the top right to open a deeper breakdown of the trace, including span-level metrics and structure.
Need more help?
Contact support in the chat bubble and let us know how we can assist.