Metrics Drilldown
Drill down into metrics to find trends and anomalies.
Navigate to Metrics Drilldown from the left-hand sidebar to explore Prometheus-compatible metrics without writing PromQL queries.
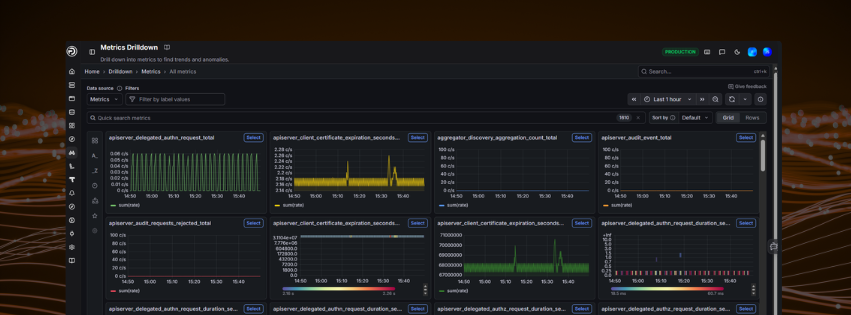
Filters
| Filter | Description |
|---|---|
| Data source | Select the Metrics data source |
| Filter by label values | Narrow metrics by label |
| Quick search metrics | Type to search across all available metrics |
| Sort by | Order results. Options are Default (alphabetical with recently-selected metrics first), Alphabetical [A-Z], Alphabetical [Z-A], Dashboard Usage (prevalence in dashboard panel queries), and Alerting Usage (prevalence in alerting rules) |
| View | Switch between Grid and Rows layout |
| Time range | Set the window using the picker in the top right. Use « to move the range back 30 minutes and » to move it forwards, the zoom out icon to widen the range, and the refresh icon to reload. The ⓘ Plugin info icon (far right) shows the plugin version, changelog, documentation, and links to contribute or report an issue |
The total number of matching metrics is shown next to the search bar (e.g., 1613).
Left toolbar
The vertical icon rail on the left opens additional filter panels. Each panel filters the metric grid, and selections can be cleared with clear.
| Icon | Panel | Description |
|---|---|---|
| Rules filters | Rules filters | Filter by Non-rules metrics or Recording rules (each with a count) |
| A_ | Prefix filters | Filter metrics by name prefix (e.g., mysql, go, node). Includes a Search box and a Hide empty toggle |
| _Z | Suffix filters | Filter metrics by name suffix (e.g., total, count, bytes). Includes a Search box and a Hide empty toggle |
| Clock | Recent metrics filters | Limit to metrics seen within a time window (All time, or Past 1m through Past 24h) |
| Group by labels | Group by labels | Search and select labels to group the metrics by |
| Star | Bookmarks | Saved metrics for the current data source |
| Settings | Settings | Labelled Settings on hover; may be unavailable depending on your configuration |
Browsing metrics
A dynamic grid of metric panels is displayed, each representing a specific Prometheus metric. Click Select on any panel to drill into that metric in more detail.
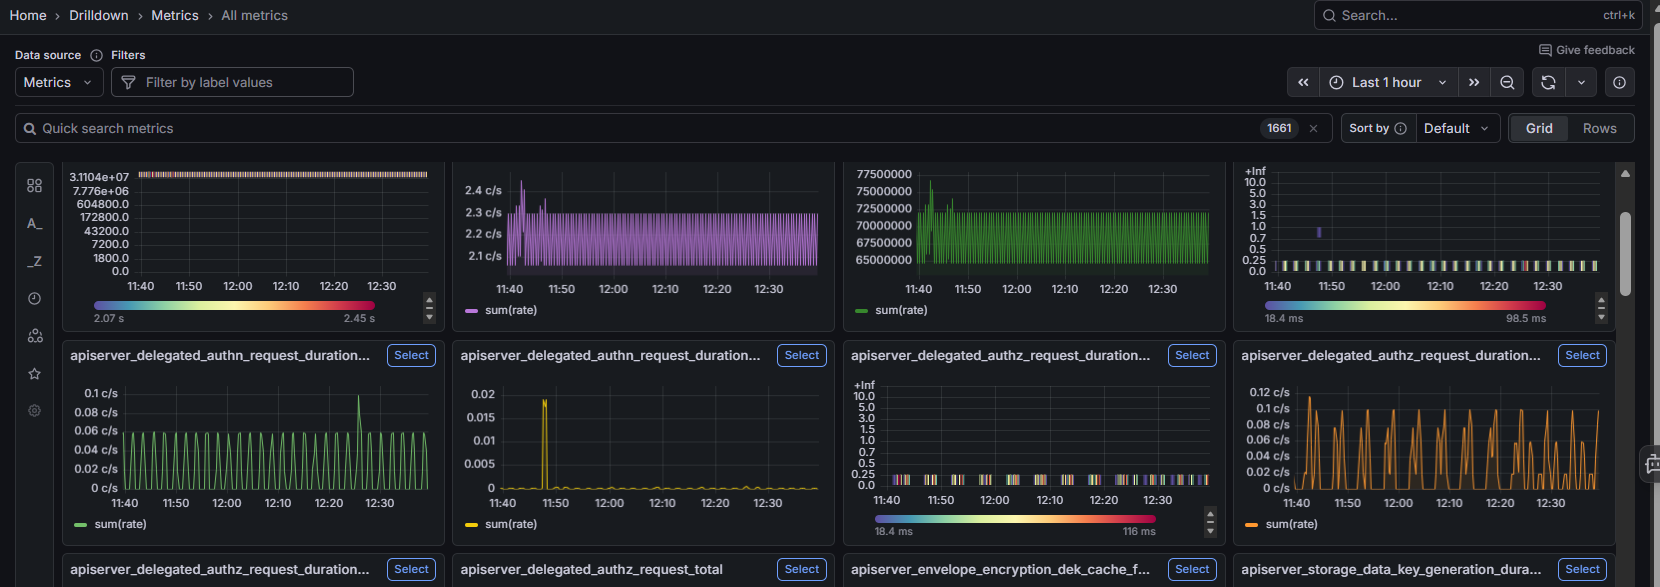
Search & filter metrics
Use search and filters to quickly narrow down the metrics you want to investigate - by system, service, or time frame. This helps you focus on what matters most.
To filter:
- Use the Filter by label values dropdown to select specific services or tags.
- Or type in the Quick search metrics box (e.g.,
cpu), then press Enter.
Matching metrics will appear. From here, you can dive deeper into your analysis.
Investigate the data
Once you’ve filtered your metrics, it’s time to analyze the data for patterns or unusual behavior. Understanding your system’s normal (baseline) performance makes it easier to spot issues.
-
Review the metric panels and look for ones with noticeable changes.
- Metrics with little variation (e.g., JVM Uptime) are typically less insightful.
- Focus on dynamic and performance-critical metrics (e.g., CPU Usage, Heap Memory Used, or Request Throughput) to uncover trends and potential issues.
-
Click Select on a metric to open the detail view.
-
Adjust the time range using the time picker in the top right if needed.
Metric detail view
Clicking Select on a metric opens the detail view. The breadcrumb updates to show your current path (e.g., Home > Drilldown > Metrics > metric_name > Breakdown).
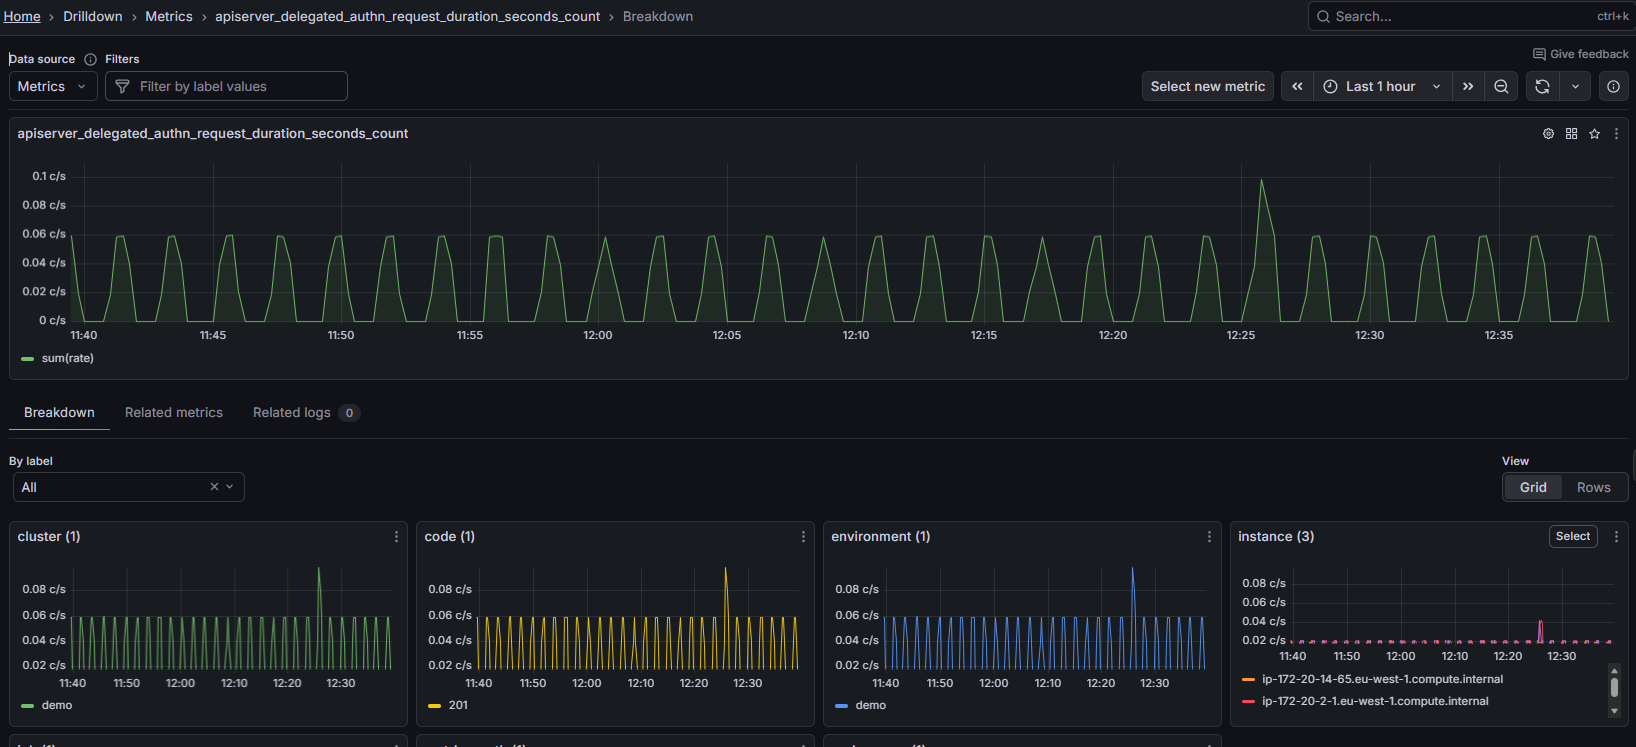
The main graph shows the selected metric over the chosen time range. Use Select new metric (top right) to switch to a different metric without going back.
The icons in the top-right corner of the graph panel let you:
| Icon | Action |
|---|---|
| ⚙ (gear) | Configure the Prometheus function |
| Grid | Add to dashboard |
| ☆ (star) | Add to bookmark |
| ⋮ (more) | Open in Explore or Copy URL |
Configure the Prometheus function
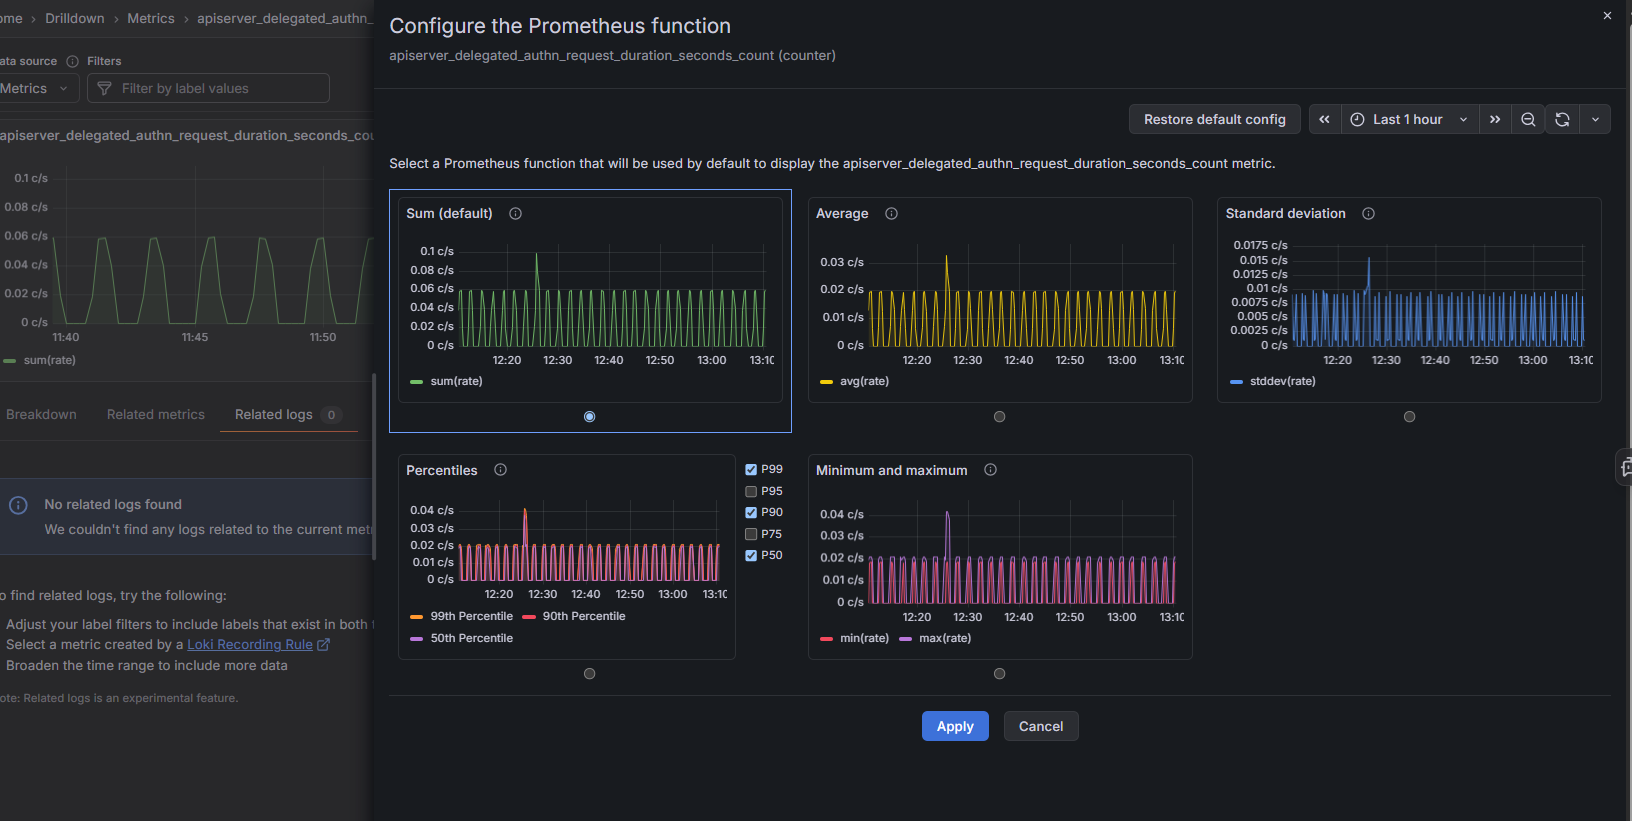
Click the ⚙ (gear) icon to choose the default Prometheus function used to display the metric. Each option shows a preview so you can compare before applying:
| Function | Description |
|---|---|
| Sum (default) | Total across all series (sum(rate)) |
| Average | Mean across series (avg(rate)) |
| Standard deviation | Spread of values across series (stddev(rate)) |
| Percentiles | Selected percentiles (P99, P95, P90, P75, P50) |
| Minimum and maximum | Lowest and highest values across series (min(rate) / max(rate)) |
Click Apply to use the selected function, or Restore default config to revert to Sum.
Tabs
| Tab | Description |
|---|---|
| Breakdown | Breaks the metric down by label. Use the By label dropdown to choose a label (e.g., cluster, instance, job). Each label value appears as its own panel. |
| Related metrics | Lists similar metrics based on shared keywords. Use this to discover related signals. |
| Related logs | Shows log entries correlated with the selected metric. |
Breakdown view
The Breakdown tab is the default view after selecting a metric. It displays a grid of panels - one per label value - so you can see how the metric differs across instances, environments, jobs, or other dimensions.
- Use the By label dropdown to switch between label dimensions.
- Switch between Grid and Rows layout using the view toggle.
- Click the ⋮ (more) icon on any panel to open its menu, which includes Explore (Navigation) and Copy URL (Actions).
Open a metric in Explore
To drill deeper into a specific label panel:
- Click the ⋮ (more) icon on the panel to open its menu.
- Under Navigation, click Explore to open it in Explore view with the full query pre-filled.
- From here, modify the query, adjust the time range, or switch between graph and table views.
Explore is great for experimenting with queries and uncovering deeper insights without needing to build a full dashboard.
Under Actions, click Copy URL to copy a direct link to the panel.
Add metrics visualization to a dashboard
From the metric detail view, you can add the graph directly to a dashboard using the icon in the top-right corner of the panel.
-
In the top-right corner of the metric graph, click the Add to dashboard icon (grid icon).
-
Choose one of the following:
- New dashboard – to create a new one
- Existing dashboard – and pick one from the list
-
Click Open dashboard to view it.
-
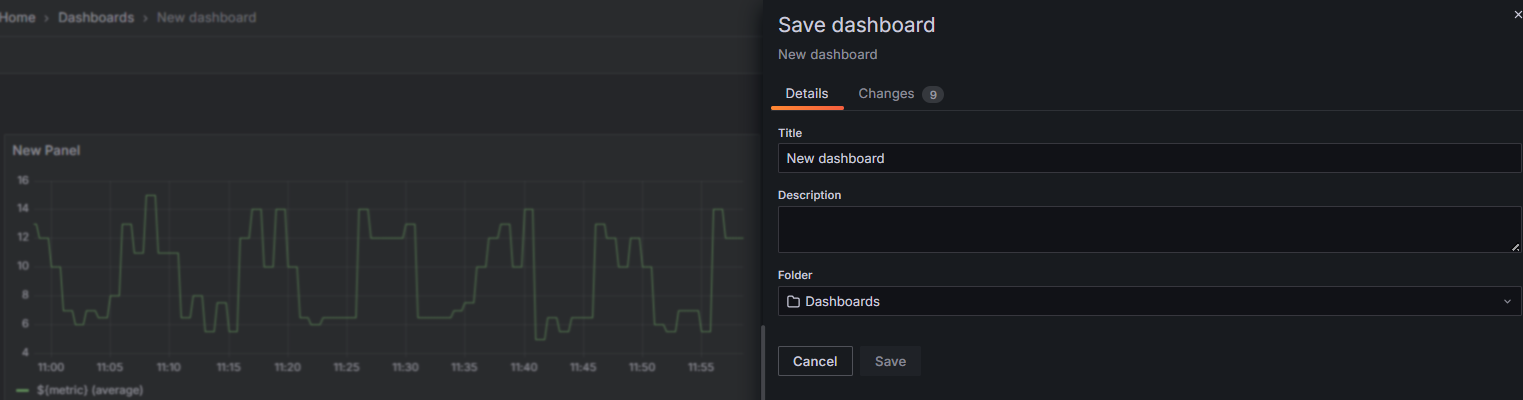
Click Save dashboard in the top-right corner.
-
Give your dashboard a name and description, choose a folder (if needed), and click Save.
Learn more