Crash Protection
Crash Protection is a diagnostic feature available starting in version 2025.2. It provides deep visibility into runtime behavior when a Crash Protection (CP) event occurs. The feature uploads detailed crash snapshots to the cloud, enabling analysis of system state at the moment a triggering exception or condition occurred.
Crash Protection captures key runtime metrics:
- Heap memory usage at the time of the event
- CPU utilization
- Active web request count
- Current database activity
Each report also includes the exception or condition that triggered the protection event (e.g., an ArrayIndexOutOfBoundsException, memory threshold breach).
When a CP event occurs, the system captures a snapshot and uploads it to the cloud. These reports include:
- The triggering request
- Active threads at the time of capture
- System resource utilization
- Database activity
- Lock information
- Stack traces
A time picker allows filtering events by any time range.
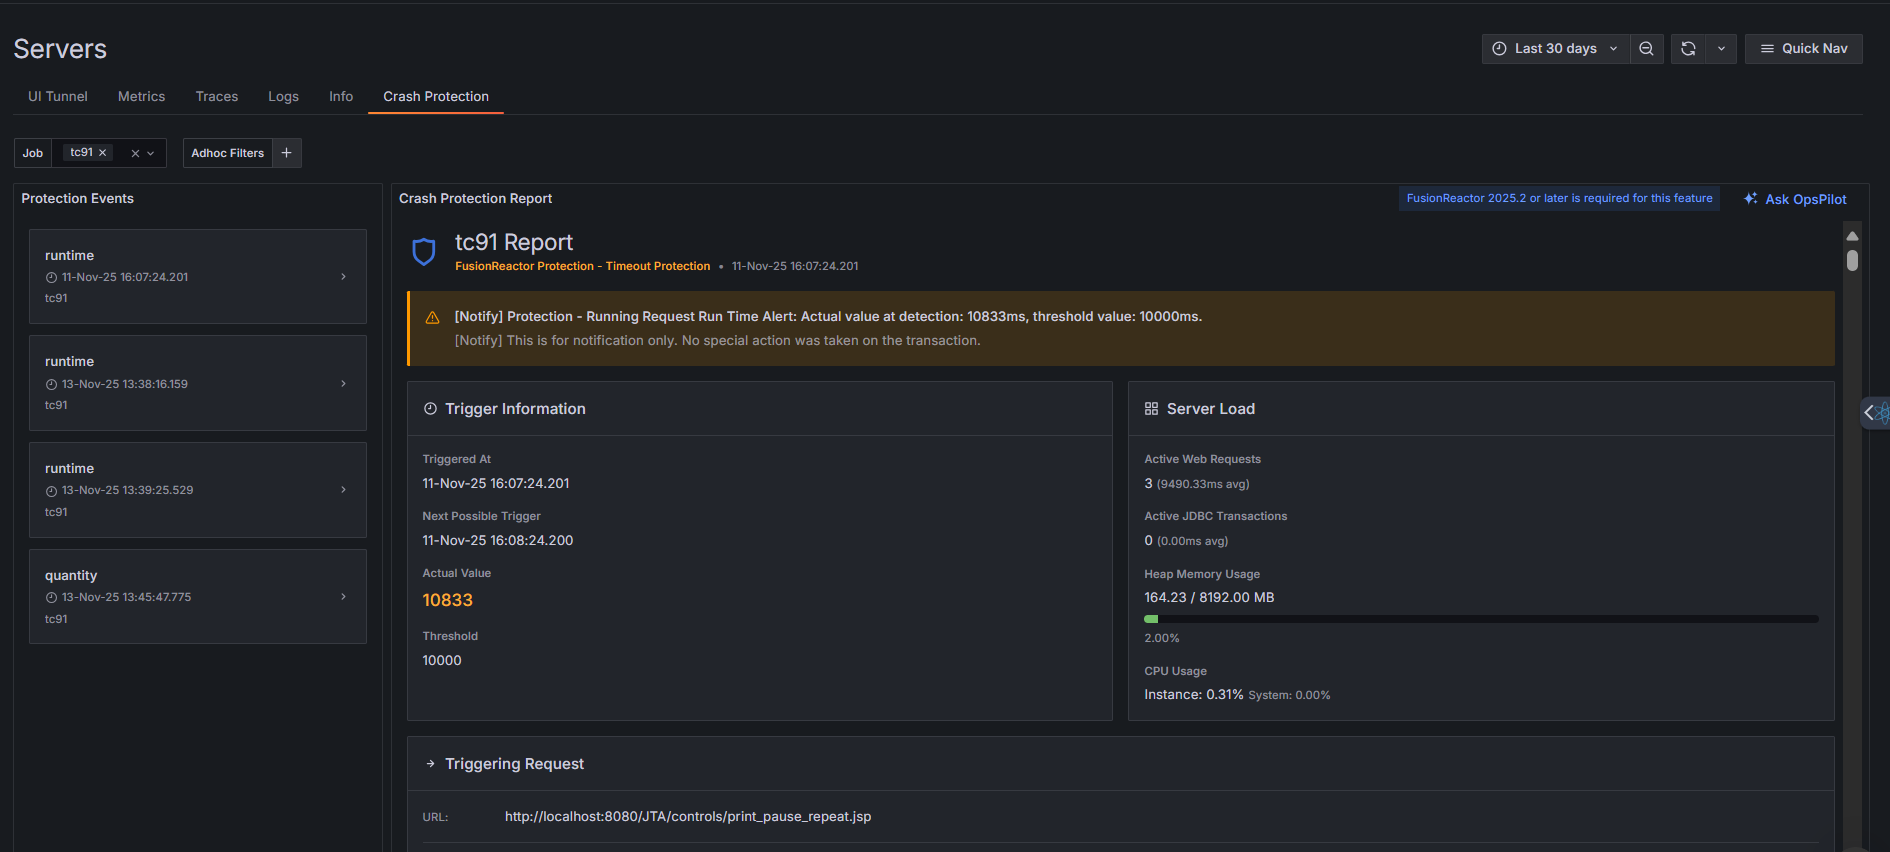
Viewing Crash Protection events
On the left side of the Crash Protection page, a Protection Events panel lists all captured CP events for the selected job and time range. Each event shows the type (e.g., runtime, memory, quantity) and timestamp.
Clicking any event in this list opens its full details in the Crash Protection Report section on the right. This report provides a complete breakdown of the system state at the moment the event was triggered.
Crash Protection Report structure
Each Crash Protection Report contains several key sections that provide context and diagnostics for the event:
Alert summary
The notification banner at the top explains the nature of the protection event:
- Current State - Key metrics at the time of trigger (e.g., free memory: 87%, used memory: 13%).
- Threshold Value - The configured limit that triggered the alert (e.g., 3% memory threshold).
- Trigger Timing - When the protection activated and for how long.
- Action Taken - Whether this was notification-only or if protective measures were applied.
Trigger information
Displays the exact conditions that caused the alert:
- Triggered At - Exact timestamp when the threshold was exceeded.
- Next Possible Trigger - When the system will check again (helps prevent alert fatigue).
- Actual Value - The metric value that exceeded the threshold.
- Threshold - The configured limit for triggering protection.
Server Load panel
Real-time server metrics at the moment of capture:
- Active Web Requests - Current HTTP requests being processed (with average timing).
- Active JDBC Transactions - Database connections in use (with average timing).
- Heap Memory Usage - Current memory consumption vs. total available.
- Displayed as both a progress bar with percentage and actual values (e.g., 124.81 / 910.30 MB).
- CPU Usage
- Instance - This specific application instance.
- System - Overall server CPU utilization.
Triggering Request
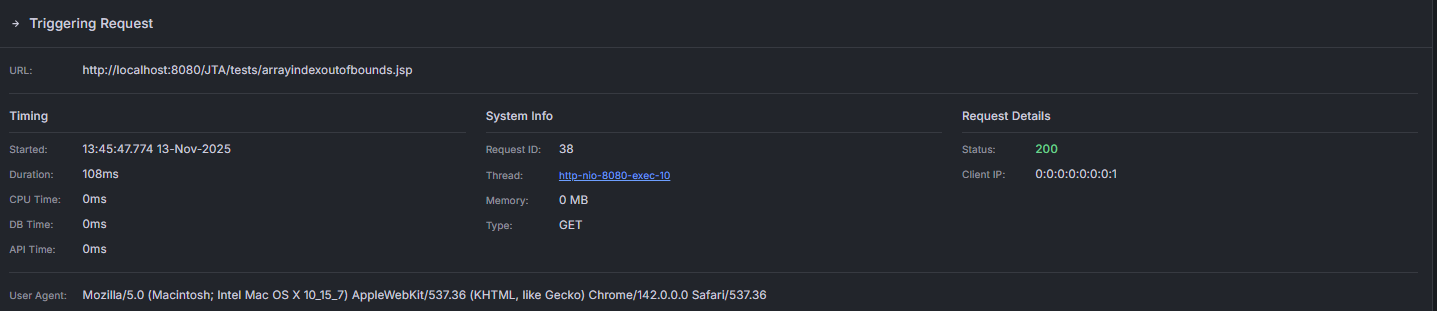
Details about the specific request that was active when protection triggered:
Request identification: - URL - The endpoint being accessed. - User Agent - Client making the request (browser, tool, API client, etc.).
Timing information: - Started - When the request began. - Duration - How long the request has been running. - GPU Time - Graphics processing time (if applicable). - DB Time - Database query time. - API Time - External API call time.
System information:
- Request ID - Unique identifier for tracking and correlation.
- Thread - The execution thread handling this request (e.g., http-nio-8500-exec-5).
- Memory - Memory consumed by this specific request.
- Type - HTTP method (GET, POST, PUT, DELETE, etc.).
Request details: - Status - HTTP response code. - Client IP - Originating client address.
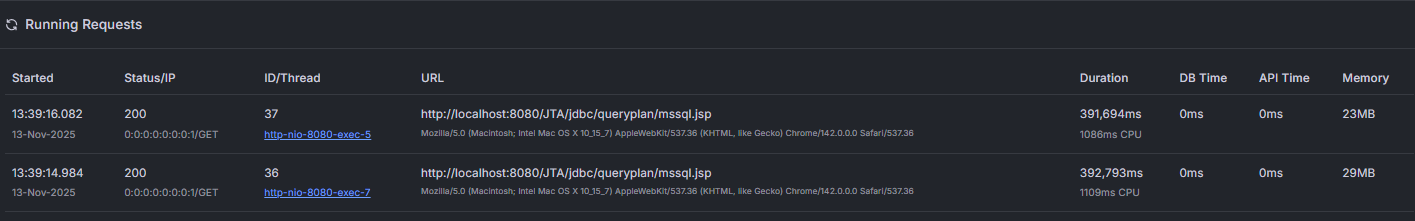
Associated requests
Other requests or threads running at the same time are displayed in the Running Requests section. If empty, displays "No running requests" - indicating the system has recovered from the condition.
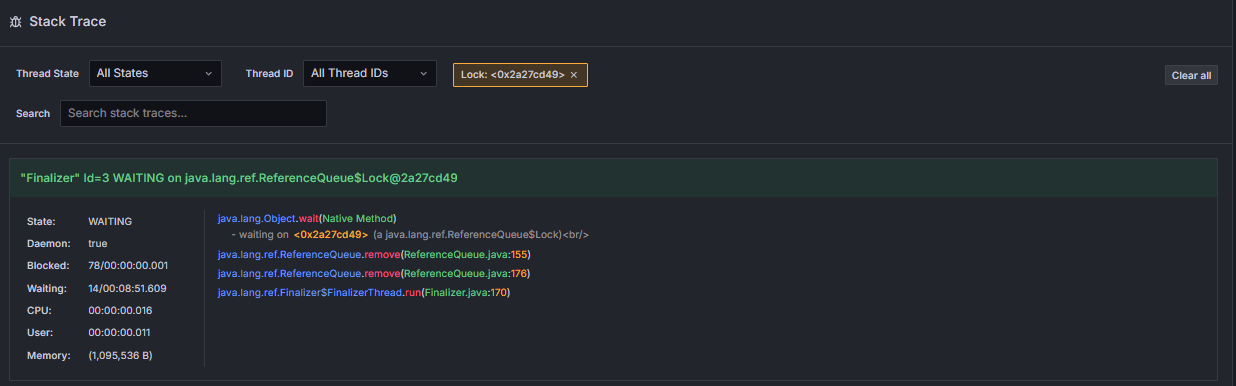
Stack Trace
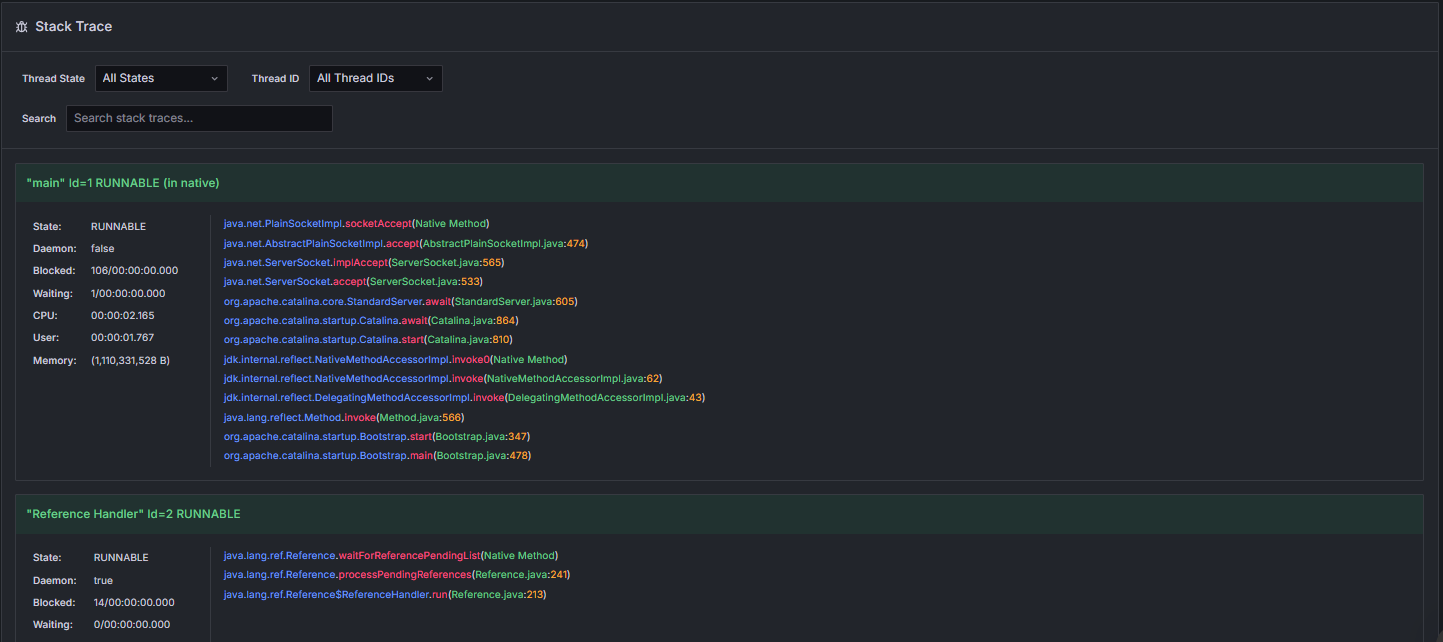
The Stack Trace panel provides thread-level debugging information:
- Thread State Filter - View specific thread states (Running, Waiting, Blocked, etc.).
- Thread ID Filter - Filter by specific thread identifiers.
- Search Field - Text search within stack traces to quickly locate relevant code.
Click any thread ID to filter the report to that thread's activity, showing its stack trace, active operation, and any locks it is waiting on.
Lock inspection
Clicking on a lock filters the display to show only the threads waiting on that specific lock.
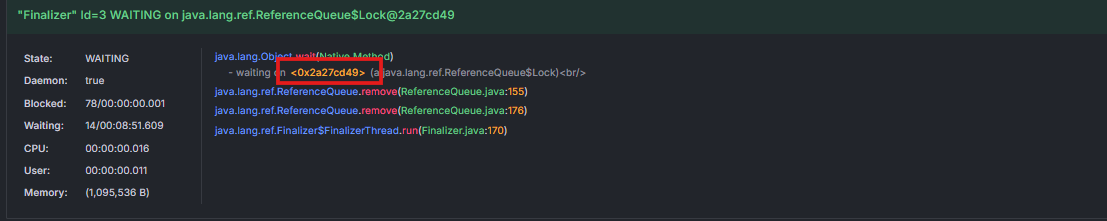
This is particularly helpful during deadlock investigations or performance bottleneck analysis.
Using Crash Protection Reports
Follow this workflow to diagnose issues effectively:
- Immediate Assessment - Review the alert summary to understand severity and type of event.
- Identify Culprit - Examine the triggering request details to see what operation caused the event.
- Analyze Load - Use server load metrics to understand overall system pressure and resource utilization.
- Debug Code - Examine stack traces to identify problematic code paths.
- Check for Contention - Review lock information and associated requests to identify blocking conditions.
- Prevent Recurrence - Adjust protection thresholds or optimize identified code sections based on findings.
Reports are retained for historical analysis and can help establish patterns in system behavior over time.
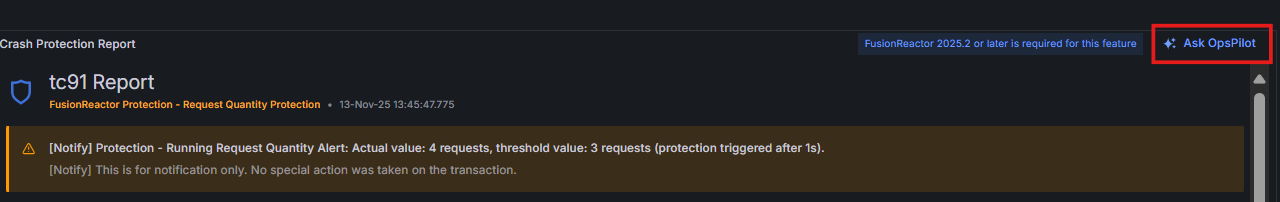
OpsPilot Integration
Each Crash Protection alert can be forwarded to OpsPilot directly from the interface. This sends the full report to OpsPilot for automated analysis and guidance.
Need more help?
Contact support in the chat bubble and let us know how we can assist.