Analytics
The Analytics page gives you a high-level view of your incident history - how quickly your team responds, how incidents are distributed by severity, and which services keep coming back as repeat offenders.
Navigate to Incidents > Analytics to open it.
Summary metrics
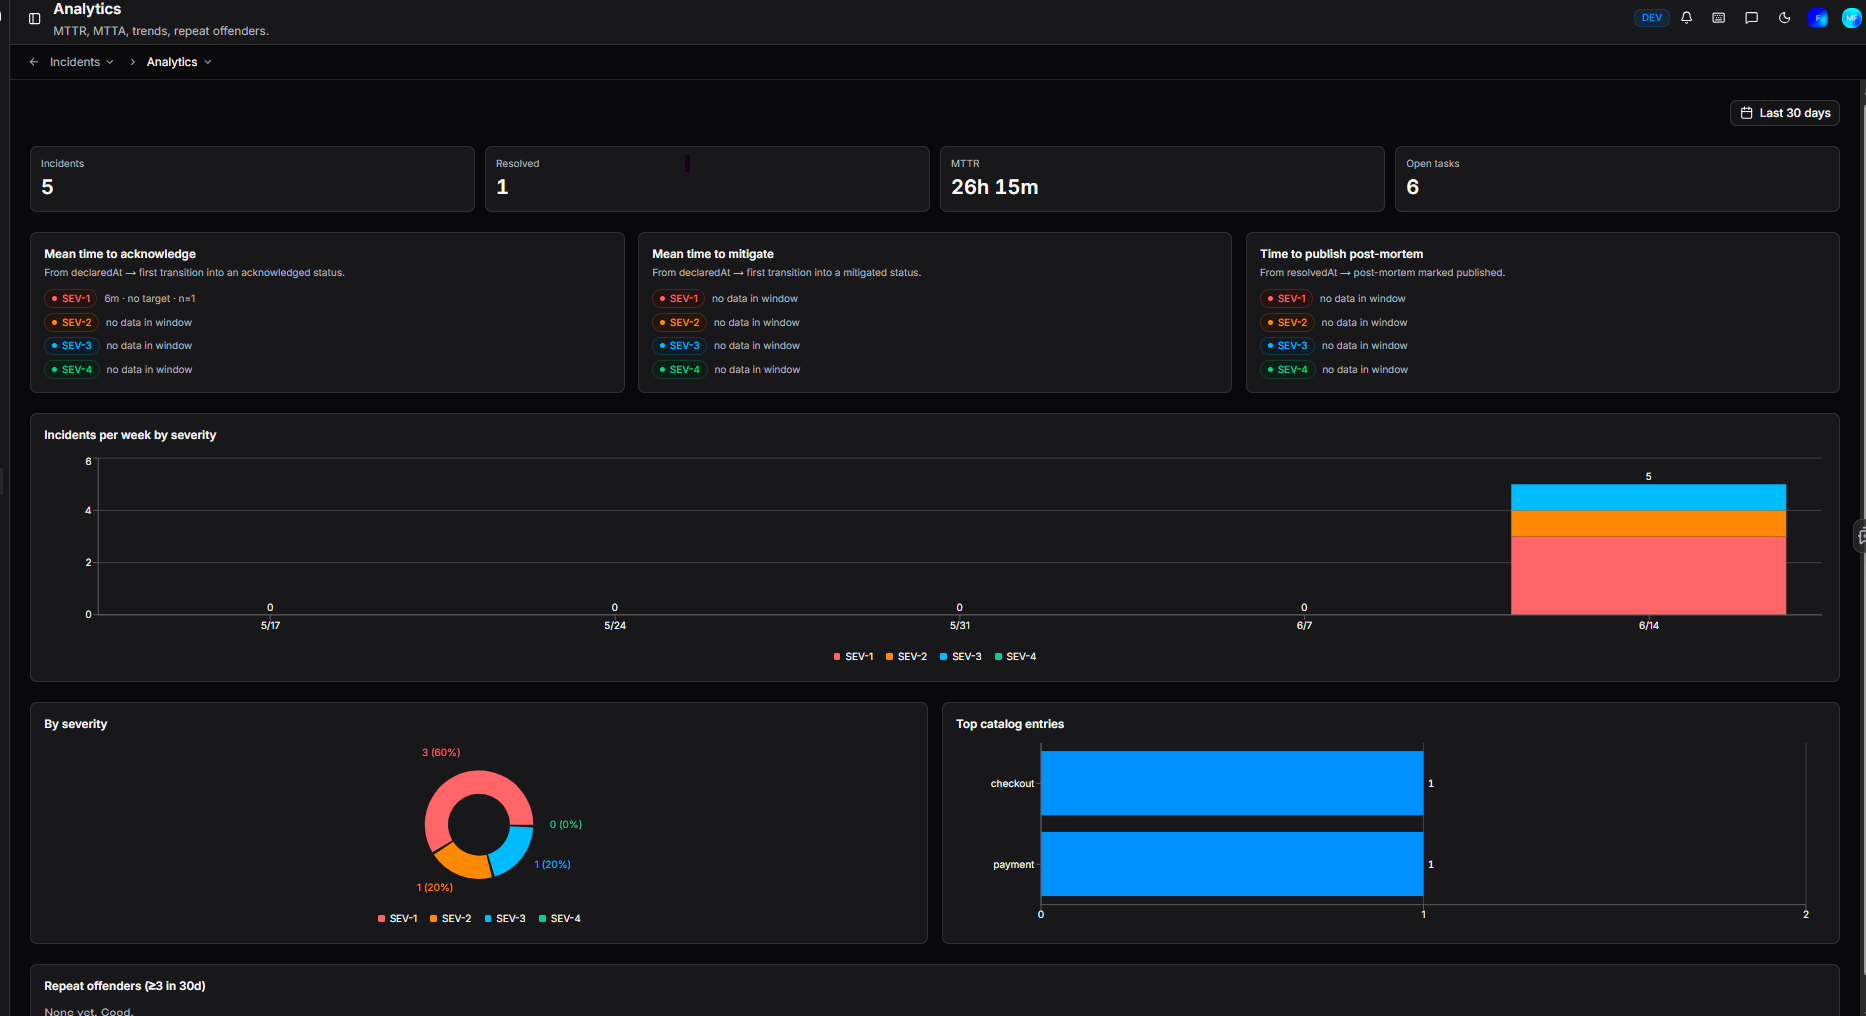
Four headline figures appear at the top of the page:
| Metric | Description |
|---|---|
| Incidents | Total incidents declared in the selected period |
| Resolved | Total incidents resolved in the selected period |
| MTTR | Mean time to resolution across all incidents |
| Open tasks | Number of tasks currently open across all active incidents |
Response time metrics
Knowing how fast your team responds is the first step to improving it. Three panels break down response times by severity (SEV-1 SEV-2 SEV-3 SEV-4), so you can see not just your overall performance but whether your process holds up differently under high-severity pressure versus lower-priority issues.
Mean time to acknowledge (MTTA) - the average time from an incident being declared to it first reaching an acknowledged status. A high MTTA often points to gaps in notification or on-call coverage. Stamped by the ack flag on a status in your configuration.
Mean time to mitigate (MTTM) - the average time from declaration to first reaching a mitigated status. This reflects how quickly your team can stop the bleeding, regardless of whether root cause is fully understood. Stamped by the mitigated flag on a status in your configuration.
Time to publish post-mortem - the average time from an incident being resolved to its post-mortem being marked as published. A useful signal for whether post-mortems are being deprioritised once the immediate pressure is off.
Charts
Incidents per week by severity - a time series chart showing incident volume over time, colour-coded by severity.
By severity - a breakdown of the total incident count by severity for the selected period.
Top catalog entries - the catalog entries most frequently associated with incidents, helping you identify which services generate the most incident activity.
Repeat offenders
The Repeat offenders section surfaces catalog entries that have been associated with three or more incidents in the last 30 days. This is a useful signal for services that may need deeper investigation or longer-term fixes rather than repeated reactive responses.
Need more help?
Contact support in the chat bubble and let us know how we can assist.