Logs
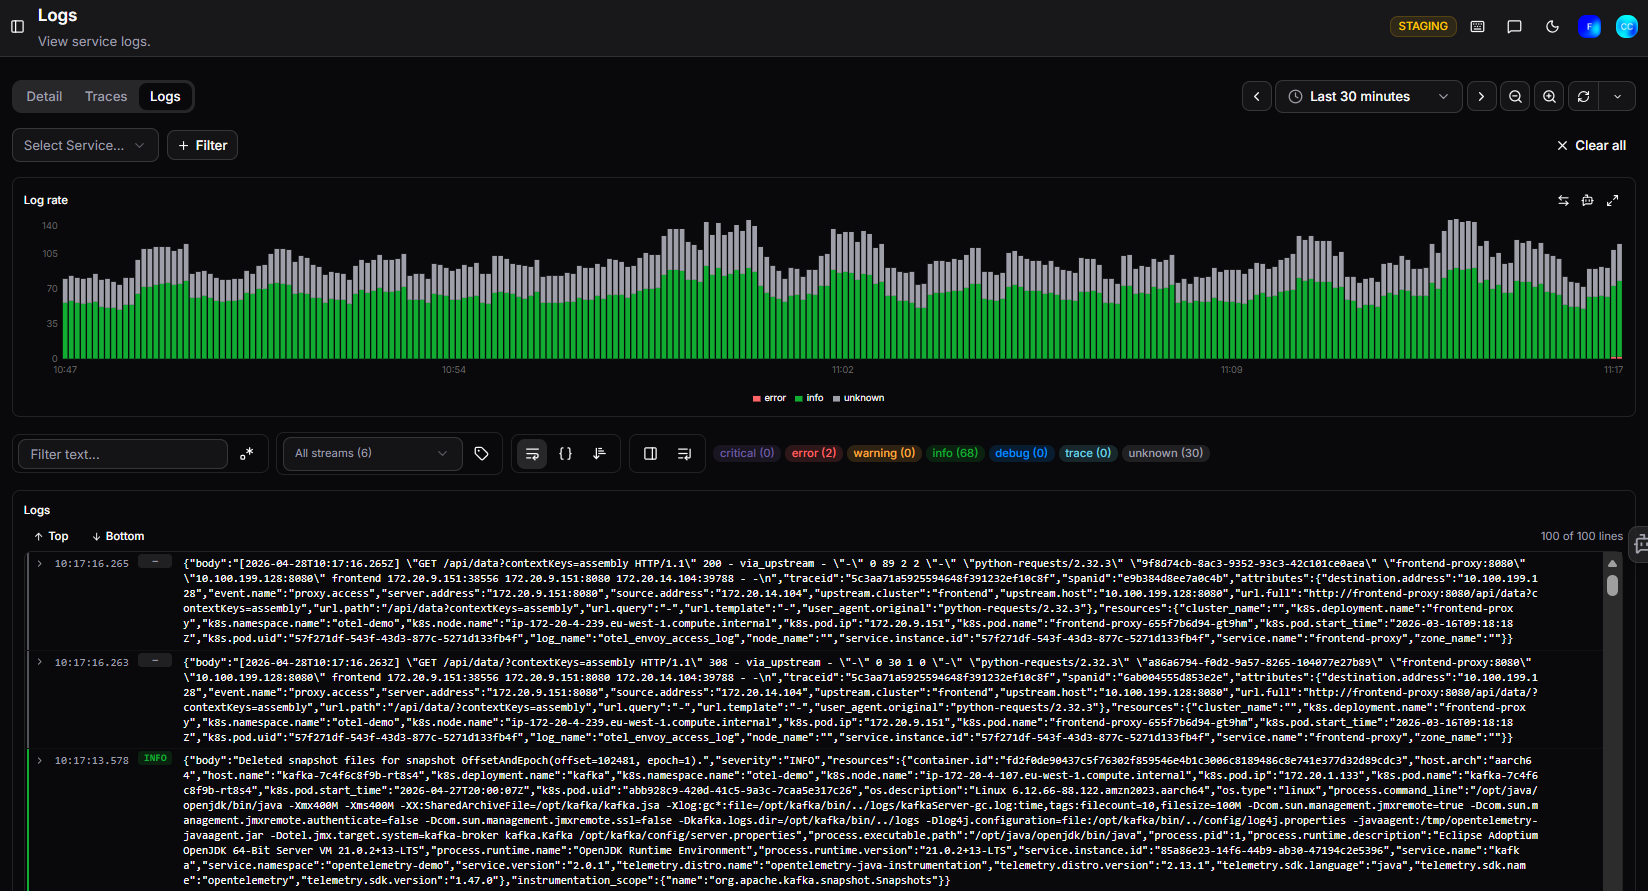
The Logs tab shows all log output for the selected service within the chosen time range. Use it to investigate errors, trace log patterns, and filter down to specific severity levels or log content.
Filters
| Filter | Description |
|---|---|
| Select Service | Filter logs to a specific service |
| + Filter | Add additional filter conditions |
| Filter text | Search log content by keyword or pattern |
| All streams | Select which log streams to include |
Click Clear all to reset all active filters.
Log Rate chart
The Log Rate bar chart shows log volume over time, colour-coded by severity:
- Red: Error logs
- Green: Info logs
- Grey: Unknown severity
Hover over a bar to see the exact counts per severity at that timestamp. Use this chart to quickly spot spikes in error output.
Severity filters
Above the log list, severity badges show the count for each level in the current view:
Critical, Error, Warning, Info, Debug, Trace, Unknown
Click a badge to filter the log list to that severity level only.
Logs list
The Logs list displays log entries in chronological order. Each entry shows:
- Timestamp
- Severity badge (e.g. INFO, ERROR)
- Log content: the full log message, expandable for long entries
The list shows up to 100 lines at a time. Use the Top and Bottom buttons to jump to the start or end of the list.
Need more help?
Contact support in the chat bubble and let us know how we can assist.