Traces
The Traces tab shows all traces for the selected service, with performance charts and a filterable trace list. Use it to investigate slow requests, errors, and individual spans in detail.
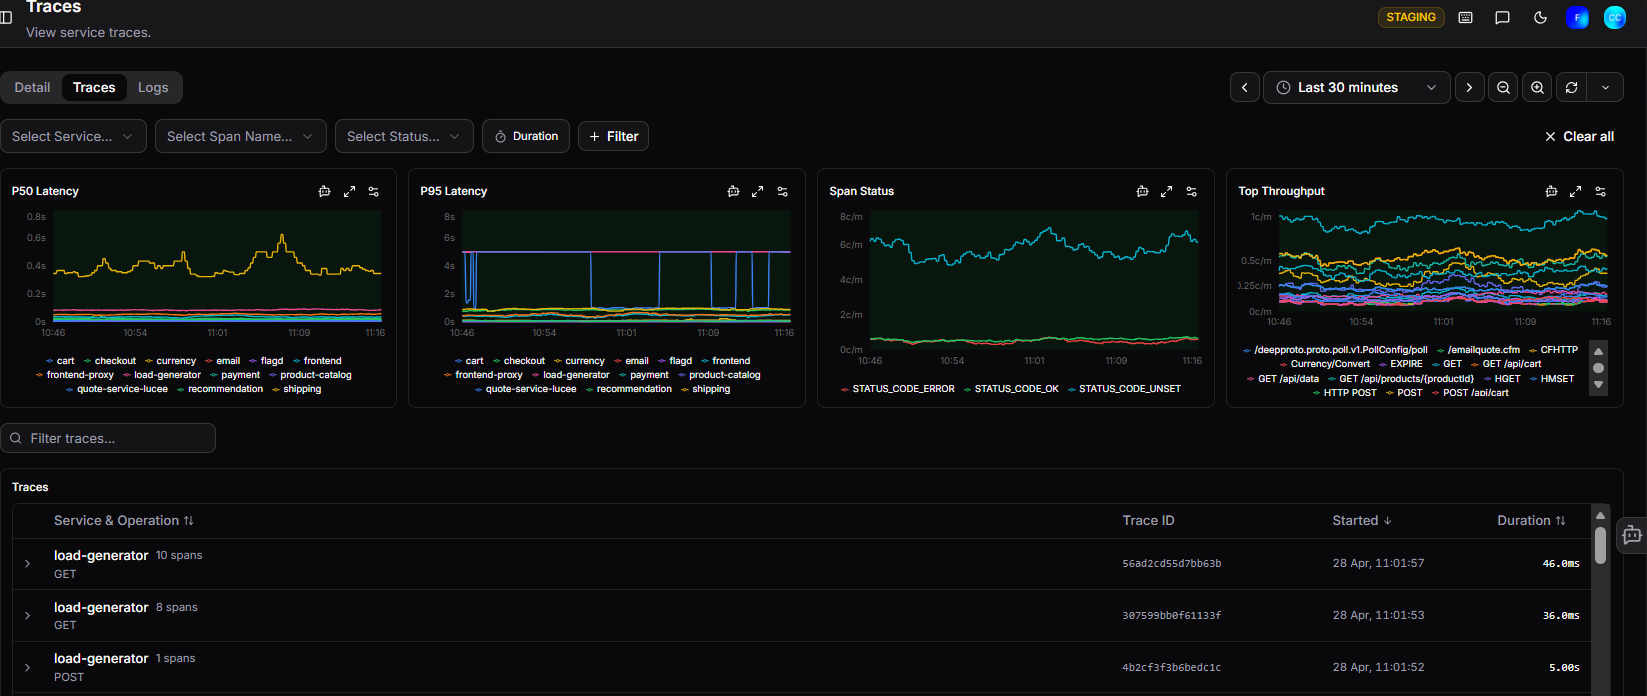
Filters
At the top of the page, use the filter bar to narrow the trace list:
| Filter | Description |
|---|---|
| Select Service | Filter by service name |
| Select Span Name | Filter by a specific operation or endpoint |
| Select Status | Filter by span status (e.g. error, ok) |
| Duration | Sort or filter by trace duration |
| + Filter | Add additional filter conditions |
Click Clear all to reset all filters.
Use the Filter traces... search box to search within the trace list by keyword.
Performance charts
Four charts give you an overview of trace performance across the selected time range:
| Chart | Description |
|---|---|
| P50 Latency | Median trace duration, broken down by service |
| P95 Latency | 95th percentile duration, highlighting slower traces |
| Span Status | Breakdown of span outcomes across all traces |
| Top Throughput | Most active endpoints by request volume |
Traces list
The Traces table lists individual traces with:
| Column | Description |
|---|---|
| Service | The service that originated the trace |
| Span Name | The operation or endpoint name |
| Spans | Total number of spans in the trace |
| Services | Number of services involved in the trace |
| Trace ID | The unique identifier for the trace |
| Started | When the trace began |
| Duration | Total end-to-end duration |
Traces with errors are highlighted in red with an ERROR badge.
<root span not yet received>
This entry appears when child spans have been received but the root span hasn't arrived yet. This is usually transient - the root span typically arrives shortly after.
Expanded trace view
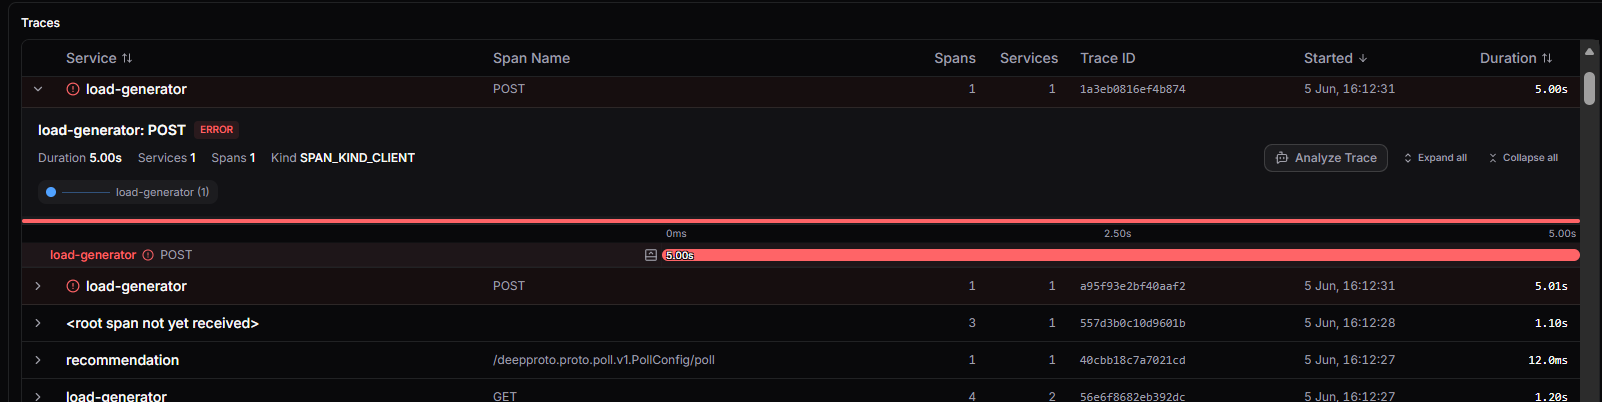
Click the > arrow on any row to expand it and see a summary and waterfall timeline for that trace:
- Service and span name with an ERROR badge if the trace contains errors
- Duration, Services, Spans, and Kind (e.g.
SPAN_KIND_CLIENT) - A waterfall timeline showing how time was spent across spans
- A service breakdown showing each service involved and its span count
Three buttons in the top right of the expanded view let you:
- Analyze Trace - send the trace to OpsPilot AI for analysis
- Expand all - expand all spans in the waterfall at once
- Collapse all - collapse all spans in the waterfall at once
Need more help?
Contact support in the chat bubble and let us know how we can assist.