Explore
When you know what you're looking for, Explore lets you query it directly. Skip the dashboard, pick a datasource, build or write your query, and get the answer, without creating a panel or navigating through a pre-built view.
Navigate to Explore from the left-hand sidebar.
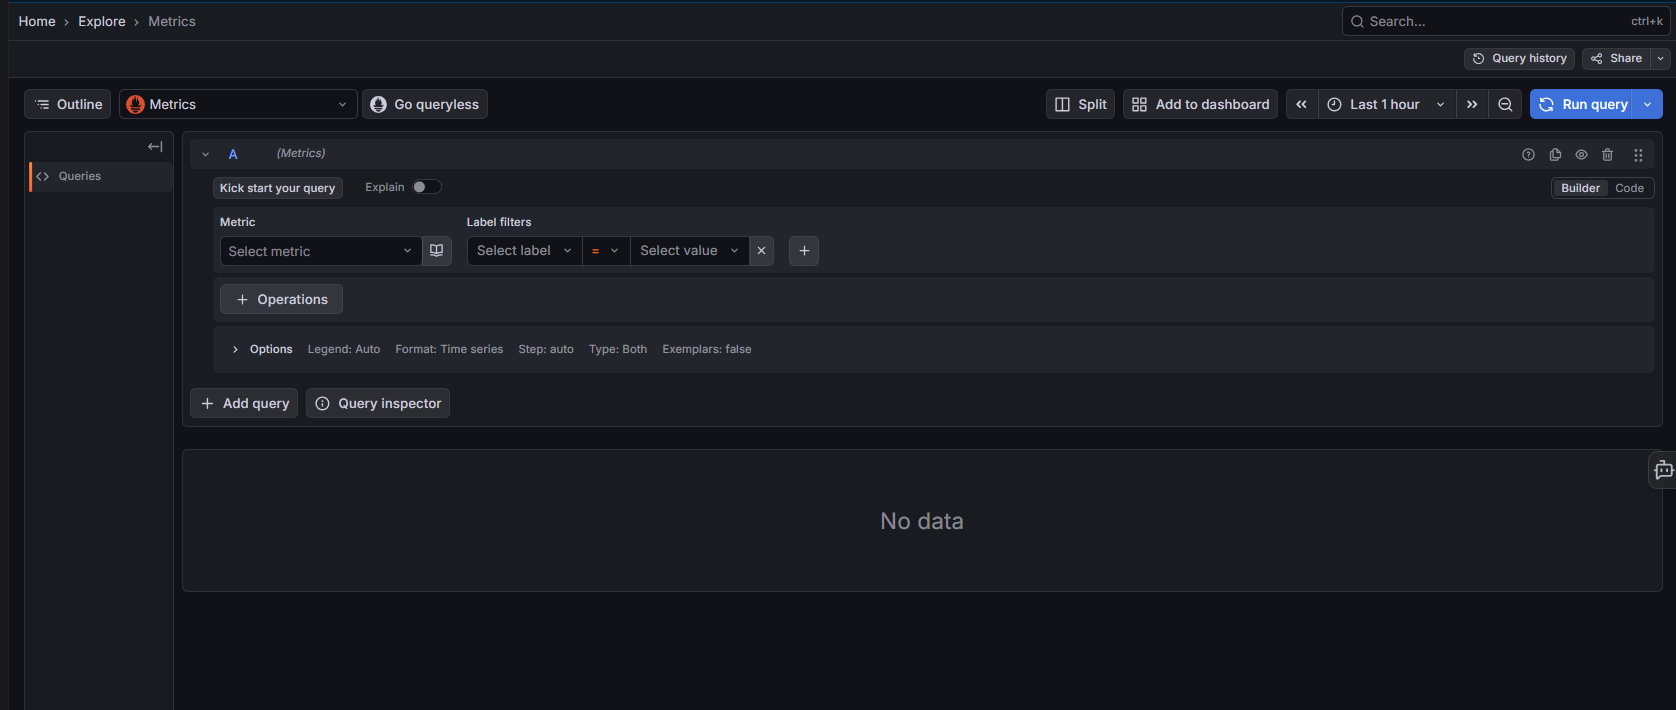
Datasources
Use the datasource dropdown at the top left to choose what you're querying:
| Datasource | Description |
|---|---|
| Metrics | Prometheus-compatible metrics from your instrumented services |
| Logs | Log data ingested from your services and log shippers |
| Traces | Distributed trace data from your OpenTelemetry-instrumented services |
The query builder updates to match the selected datasource.
Go queryless
Click Go queryless to switch to the guided Drilldown experience for the current datasource. A dialog asks whether to open in the current tab or a new tab.
 Drilldown views let you browse and filter without writing queries:
- Metrics Drilldown: browse metrics, filter by label, and explore breakdowns
- Logs Drilldown: browse log streams, filter by label and severity, and explore patterns
- Traces Drilldown: explore span rate, errors, and duration across services
Query builder
Each query appears as a labelled panel (A, B, C...). The builder has two modes, toggled in the top right of the query panel:
| Mode | Description |
|---|---|
| Builder | Visual query builder: select metric, add label filters, and add operations without writing query language |
| Code | Raw query editor: write PromQL, LogQL, or TraceQL directly |
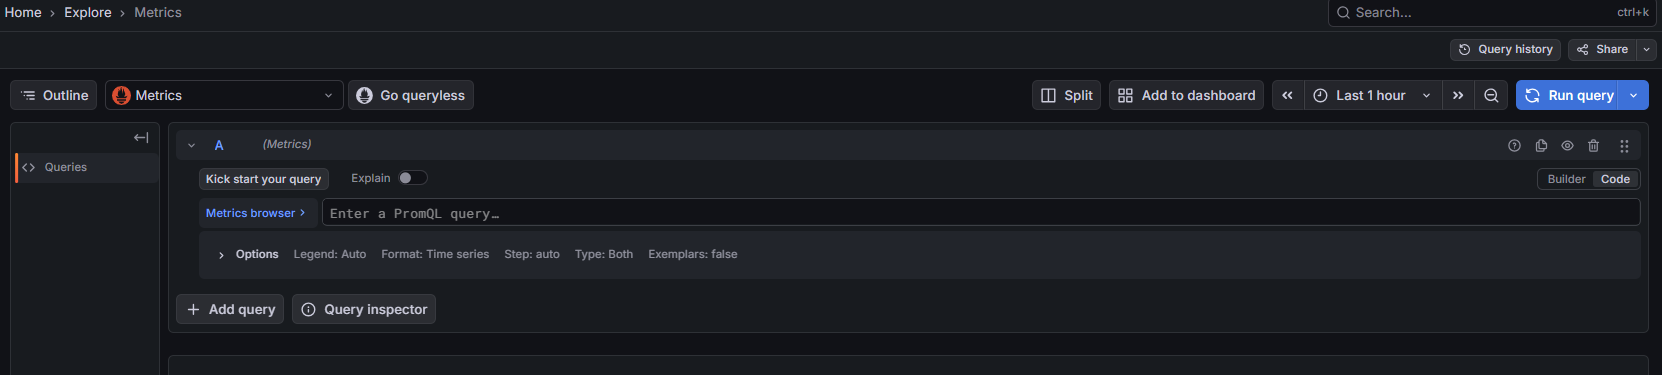
In Code mode, click Metrics browser to look up available metrics and labels while you write your query.
Metrics query builder
| Field | Description |
|---|---|
| Metric | Select the metric to query |
| Label filters | Filter by label key, operator, and value. Click + to add more filters |
| + Operations | Add functions such as rate(), sum(), avg(), or histogram_quantile() |
Expand Options to configure:
| Option | Description |
|---|---|
| Legend | How series are labelled in the chart (Auto, Verbose, Custom) |
| Format | Output format: Time series, Table, or Heatmap |
| Step | Query resolution step |
| Type | What to display: Both, Metrics, or Exemplars |
| Exemplars | Toggle exemplar display on the chart |
Click Kick start your query to get a pre-built query template for common use cases.
Toggle Explain to see a plain-language description of what your current query does.
Adding queries
Click + Add query to add a second query to the same view. Multiple queries render on the same chart, making it easy to compare signals.
Click Query inspector to see the raw request and response for debugging query issues.
Running queries
Click Run query (top right) to execute the current query. The results appear in the panel below.
Use the time range selector to adjust the period. The navigation arrows step backwards and forwards by one time range window.
Split view
Click Split to open a second Explore panel side by side. Useful for comparing two different queries, datasources, or time ranges at once.
Add to dashboard
Click Add to dashboard to add the current query directly to a new or existing dashboard without leaving Explore.
Query history
Click Query history (top right) to see your recent queries. Rerun or modify a past query without having to rebuild it from scratch.
Share
Click Share to generate a link to the current Explore view, including the datasource, query, and time range.
Need more help?
Contact support in the chat bubble and let us know how we can assist.