Logs Drilldown
Search, filter, and analyze logs across services.
Navigate to Logs Drilldown from the left-hand sidebar to explore your log data without writing LogQL queries.
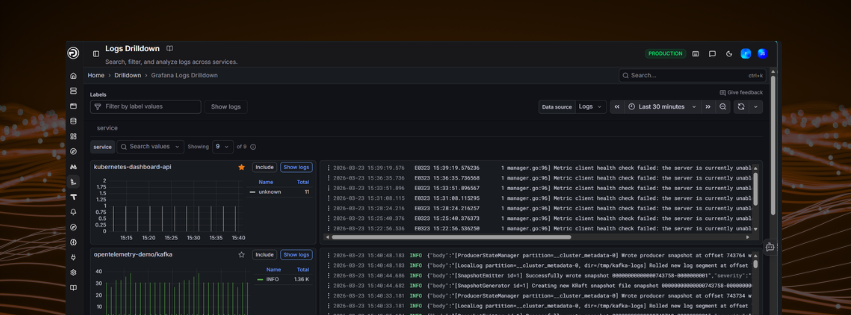
Filters
| Filter | Description |
|---|---|
| Filter by label values | Narrow services by label (e.g., service, namespace) |
| Show logs | Display raw log lines alongside service charts |
| Data source | Select the Logs data source (top right) |
| Time range | Set the time window using the picker in the top right. Use « / » to step the range backwards and forwards, the zoom out icon to widen it, and the refresh icon to reload |
Browsing services
The main view displays a list of services, each showing:
- A log volume time series chart for the selected time range
- A Name / Total breakdown listing the log levels in that service (e.g.,
info,unknown) with a count for each - A log preview panel on the right with recent log lines
- A star icon to favourite the service
- An Include button to scope the view to that service
- A Show logs button to open the full log stream for that service
Filtering by label
Use the Labels section at the top to filter services by a specific label dimension.
- Click Filter by label values and select a label (e.g.,
service). - The view updates to show matching services. The active label filter appears as a tab (e.g.,
service), along with a count of results (e.g., Showing 9 of 9). - Use the Search values dropdown to search within the label values.
- Click Include on a service to scope the view to that service only.
- Click + Add label to add another label dimension as a tab and filter across multiple labels.
Viewing logs for a service
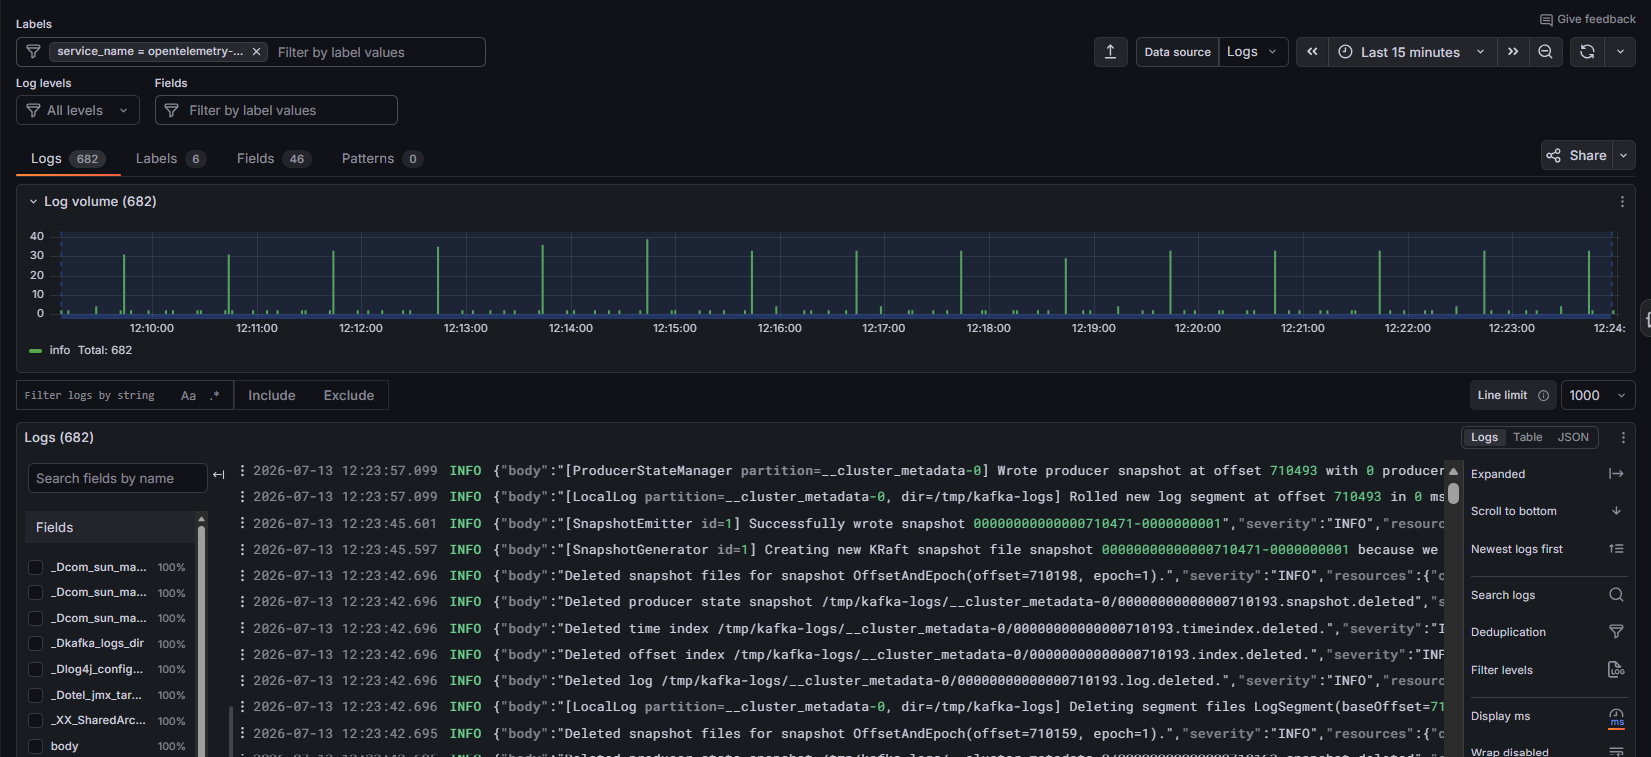
Click Show logs on any service to open its full log stream. The breadcrumb updates to Home > Drilldown > Grafana Logs Drilldown > Logs, and the active service filter is shown at the top. Click Share (top right) to generate a link to the current view. Use the collapse/expand filters icon (left of the Data source dropdown) to hide or show the filter controls.
Tabs
| Tab | Description |
|---|---|
| Logs | The default view. Shows all log lines matching the current filters, with a log volume chart above. |
| Labels | Log volume broken down by label. |
| Fields | Detected fields and their frequency across log lines. |
| Patterns | Automatically detected log patterns. Useful for spotting common issues or noise. |
Labels tab
The Labels tab shows log volume broken down by label, with one panel per label (e.g., detected_level, exporter, service_name, level, job, instance).
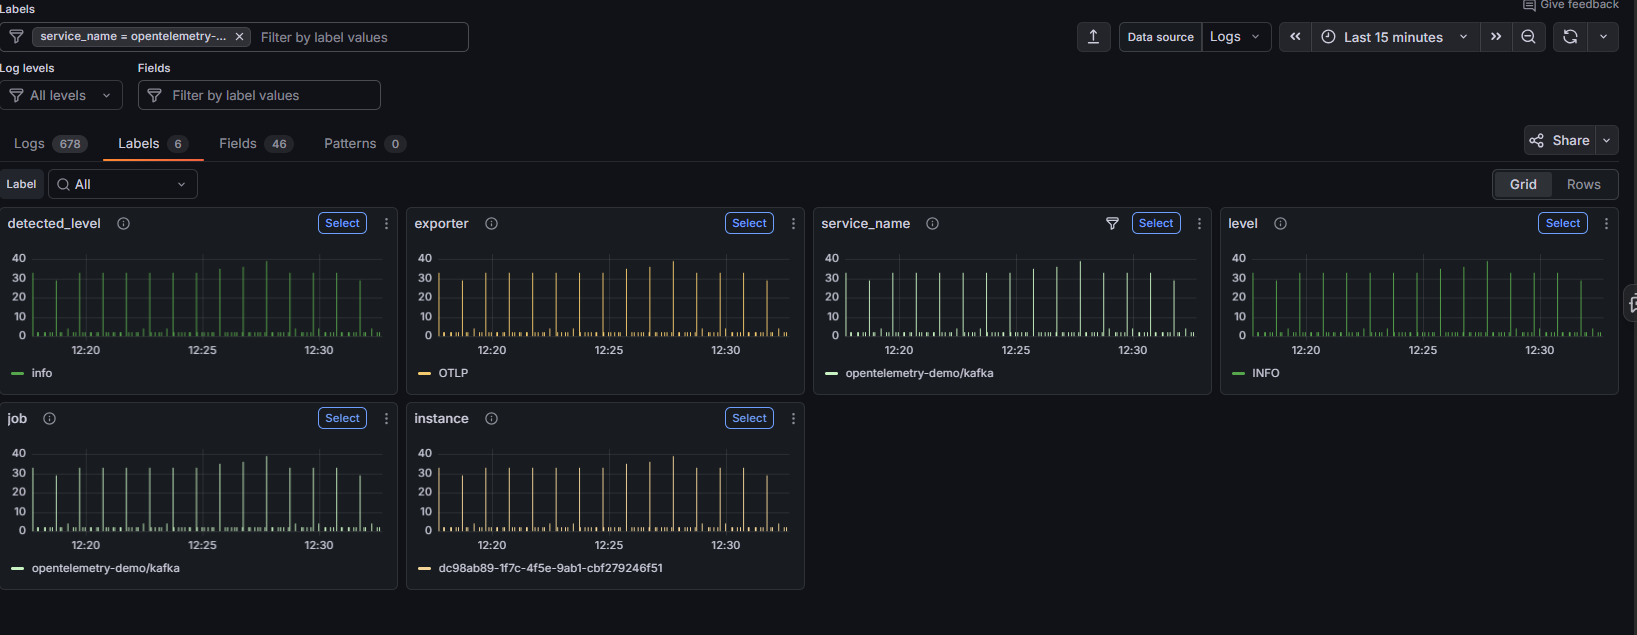
- Use the Label dropdown to focus on a specific label, or leave it on All.
- Switch between Grid and Rows layout using the view toggle.
- Click Select on any panel to drill into that label's values.
Fields tab
The Fields tab shows detected fields, with one panel per field (e.g., body, instrumentation_scope_name, partition). Fields with no values in the current range show No data.
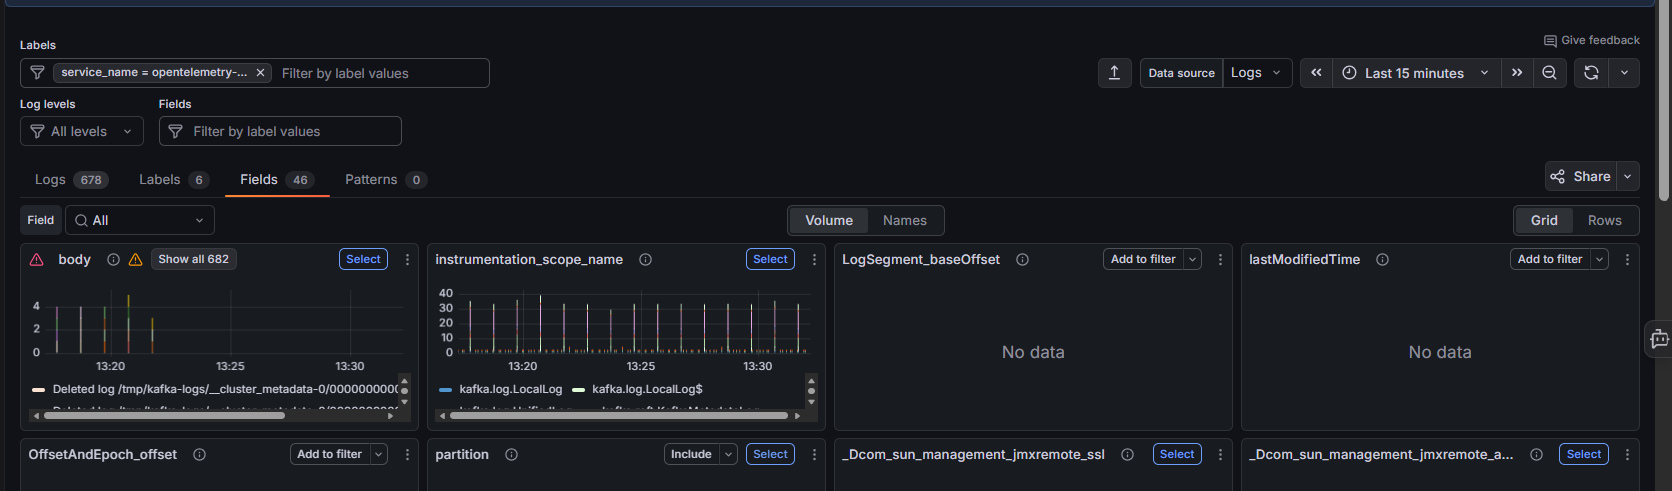
- Use the Field dropdown to focus on a specific field, or leave it on All.
- Toggle between Volume and Names at the top.
- Switch between Grid and Rows layout using the view toggle.
- Click Select to drill into a field's values, or Add to filter (with Include) to filter logs by that field.
Patterns tab
The Patterns tab groups similar log lines into patterns, making it easier to reduce noise and find hard-to-locate logs. Each pattern keeps the static text of a log line while replacing variable values with placeholders (e.g., duration=<_> trace_id=<_>), and shows a volume chart so you can spot spikes and trends at a glance.
- Patterns are detected automatically by Loki as logs are ingested (mined from recent logs).
- Use the search field to find patterns containing specific text.
- Click Include or Exclude on a pattern to show only those lines or hide noisy ones.
If no patterns are available for the current service and time range, the tab appears empty.
Log volume chart
The chart at the top shows log volume over the selected time range, colour-coded by log level (e.g., INFO). The total count is shown below the chart (e.g., INFO Total: 232).
Filtering log lines
- Use Filter logs by string to search for specific text within log lines. Toggle Aa for case-sensitive matching and .* to use a regular expression.
- Click Include or Exclude to scope or remove matching lines.
- Use the Log levels dropdown to filter by severity (e.g., INFO, ERROR, WARN).
- Use the Fields filter to narrow logs by a specific field value.
- Set a Line limit (top right) to control how many lines are loaded at once.
Fields panel
The Fields panel on the left lists all detected fields across your logs, along with the percentage of log lines that contain each field. Click any field to explore its values.
Display options
Switch between Logs, Table, and JSON views using the toggle at the top right of the logs panel.
The controls down the right-hand side adjust how the logs are displayed, including Expanded, Scroll to bottom, Newest logs first, Search logs, Deduplication, Filter levels, Display ms (millisecond timestamps), and Wrap (line wrapping).
You can click and drag on the log volume chart to zoom into a specific time window.
Learn more
Need more help?
Contact support in the chat bubble and let us know how we can assist.