Status
The Status page gives you an at-a-glance view of every alert rule's current state - a live health overview across all your alert sources, including third-party integrations. Group it by source or by namespace to see what needs attention without opening each rule one by one.
Navigate to Alerting > Status to open it.
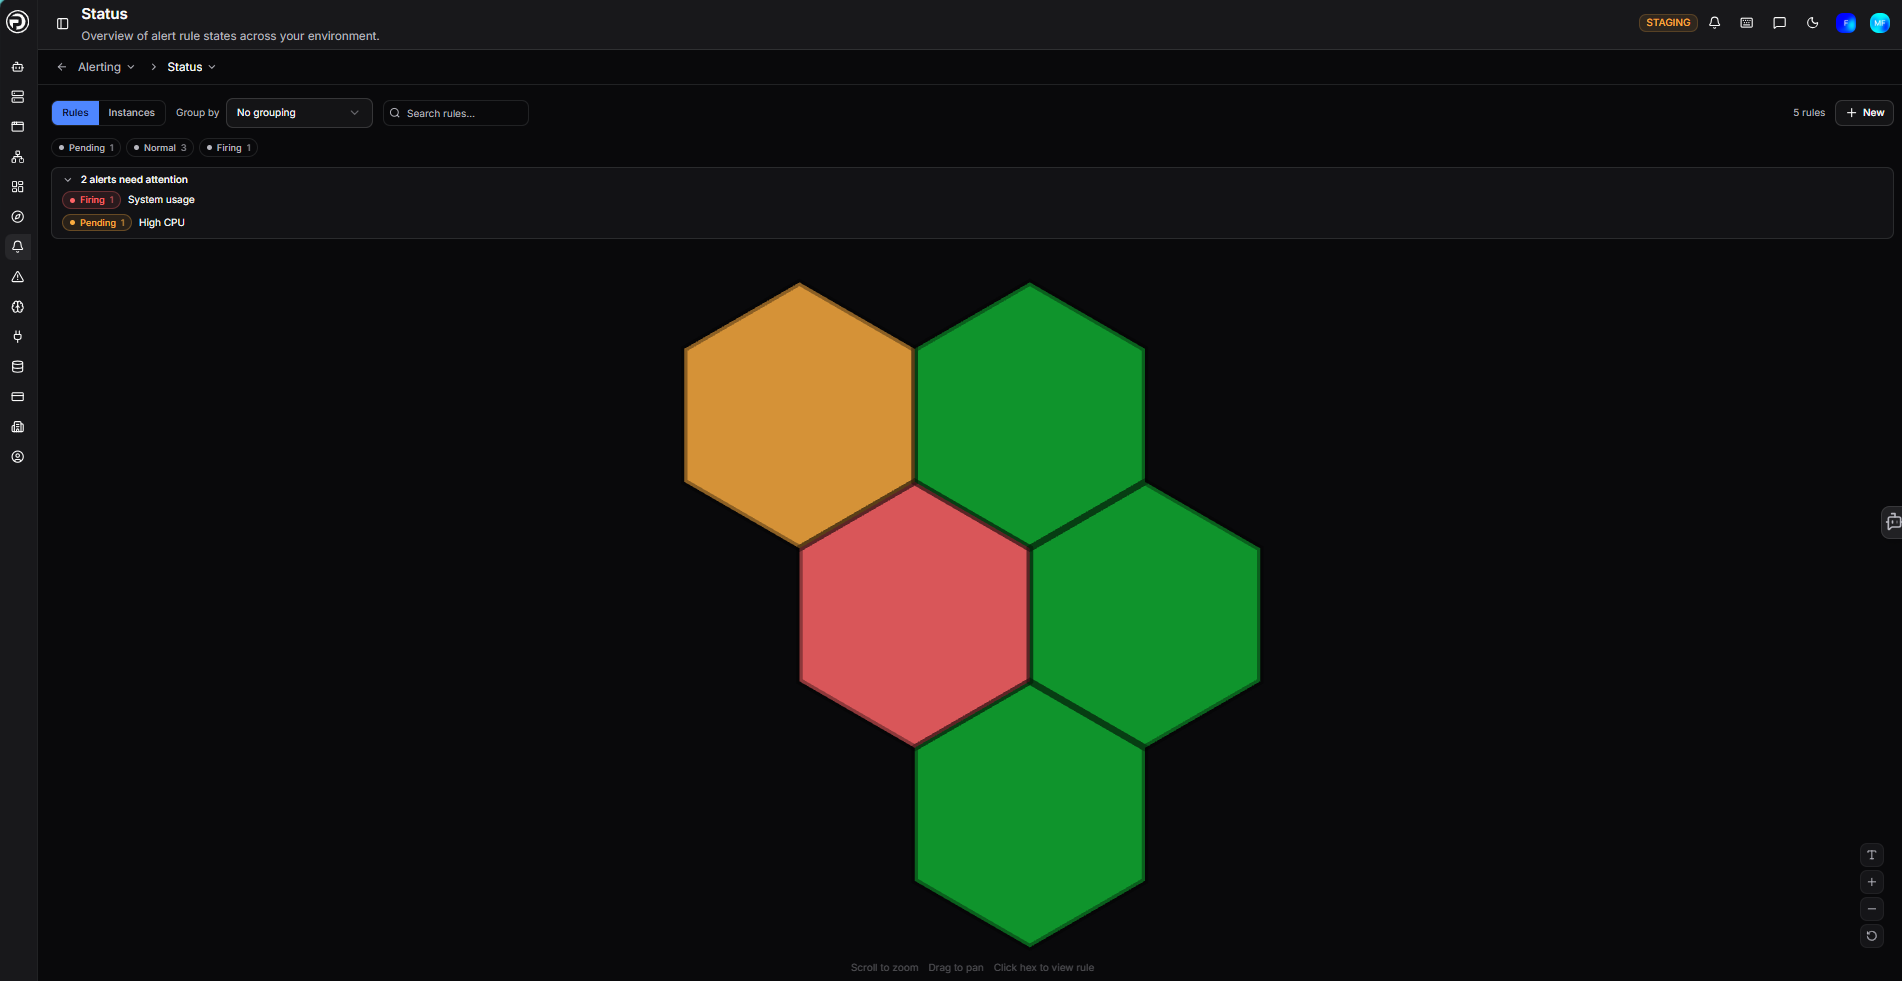
Needs attention
A summary band at the top leads with what matters: how many rules need attention out of the total, and which states they are in - for example, NEEDS ATTENTION, 1 of 70 rules — 1 pending. When everything is healthy the band reads 0 of 70 rules need attention; when something needs attention, the band is highlighted.
Below it, a health bar shows the split across states, with a chip and count for each. Only states that have rules in them appear - an account with nothing firing or pending shows just Normal and Paused.
The band always covers every rule on the account. Filtering the page to a single namespace narrows the cards below, but the band still counts the lot - so a page showing one card can still read 1 of 70 rules.
| State | Meaning |
|---|---|
| Firing | The alert condition is met and the rule is actively firing |
| Error | The rule's query failed to evaluate |
| Pending | The condition has been met, but not yet for long enough to fire |
| Recovering | The condition is no longer met and the rule is on its way back to Normal |
| Normal | The rule is evaluating and its condition is not currently met |
| No Data | The query returned no data, so there was nothing to evaluate |
| Paused | The rule is paused and not being evaluated |
These are the same seven states offered by the state filter in the toolbar.
Viewing and filtering
Controls across the top shape how the page is laid out:
| Control | Description |
|---|---|
| List / Grid | Switch between the list view and a compact grid view |
| Source / Namespace | Group the cards by data source or by namespace |
| All sources / All namespaces | Narrow the page to particular sources or namespaces - the label follows the grouping toggle. Open it for a searchable list, with Select all to take everything and Clear all to start again. Selected entries are ticked in the list, and the button itself becomes a chip naming your selection, with an ✕ to remove it |
| State filter | A multi-select controlling which rules are listed by name, with a search box and Select all. It starts on Firing, Error, Pending and Recovering - the states that need you - and reads 4 selected. Widen it to All states to list healthy rules too. Click ✕ to clear it |
| Expand all | Expand every group to show all of its rules; it toggles to Shrink all to collapse them |
| Hide filtered-out cards | Hide the groups and rules that don't match the current filters |
| Refresh interval | How often the page auto-refreshes (for example, 30s) |
| OpsPilot | Alerting AI shortcuts - Help me make a rule, or Recommend alerts to set up |
| + Wizard | Create alerting resources - a rule, contact point, or custom detector (see Creating from Status) |
Groups and rules
Rules are organized into cards - by namespace or by source, depending on the toggle. Each group card shows its name, a health bar, and a chip with a count for each state present.
The chips count everything the card holds; the state filter decides what is listed by name. Because that filter starts on Firing, Error, Pending and Recovering, a card shows only the rules wanting attention, while its chips still account for the healthy ones. A card reading Normal 11 with a single Pending rule listed is working as intended - widen the filter to All states to see the rest by name.
A card holding rules that need attention is also highlighted and moved to the front of the page, so what needs looking at is what you see first.
Each rule shows:
- Its name - for example, frontend Duration Anomaly
- Its current state and how long it has been in it - for example, Firing for 9m
- An Active toggle to enable or disable the rule - it reads Paused when the rule is off
- A mute icon to silence its notifications
- An eye icon (View rule) to open the rule's detail view
Clicking the rule itself opens a panel beside the list, with its metric graph, state history, and buttons to silence, edit, or open the full rule.
When a group holds more rules than its card shows, click Show all N rules to reveal the rest. Once they are all visible the card's footer reads All N rules shown.
Shift-click rules to select more than one at a time, then silence the whole selection in one go. See Silences.
The List view stacks the groups and shows their rule cards inline, while the Grid view lays the groups out as compact cards in a multi-column grid - each summarizing its state at a glance, and expandable to reveal the rules inside.
Creating from Status
The + Wizard button in the top right lets you create alerting resources without leaving the Status page. There are two ways into it.
Click + Wizard itself to open the What would you like to create? dialog, which describes each starting point:
| Option | Description |
|---|---|
| Alert Rule | Monitor a metric against a threshold you define. See the guided wizard |
| Anomaly Detector | Automatically detect unusual metric behavior |
| Contact Point | Set up where notifications get sent. See Contact Points |
If you are not sure which you need, click Ask OpsPilot at the bottom of the dialog for a recommendation. Click the ✕ in the top right to close the dialog without creating anything.
Creating a detector from the wizard
Choosing Anomaly Detector asks a second question - What kind of detector? - because there are two ways to get one:
| Option | Description |
|---|---|
| Custom Detector | Pick a metric and set sensitivity yourself. See Custom Anomaly Detectors |
| Service Scan | Auto-detect services from your FusionReactor agents and create rate, error, and duration detectors for each. See Service Anomaly Detectors |
Service Scan is the same action as Scan for services on the Service Anomaly Detectors page - it creates the R/E/D detectors for every service it finds, rather than one detector at a time.
The ⌄ dropdown beside the button skips the dialog and goes straight to the same three: New rule, New contact point, and New custom detector.
Need more help?
Contact support in the chat bubble and let us know how we can assist.