Service Anomaly Detectors
Picking the right threshold is hard - too tight and you drown in false alarms, too loose and you miss the real problem. Anomaly detectors flag unusual behaviour in your services automatically, so you get meaningful alerts without hand-tuning numbers.
Service detectors are auto-created for each instrumented service. To define detectors against your own PromQL queries instead, see Custom Anomaly Detectors.
Navigate to Alerting > Service Anomaly Detectors to open the page.
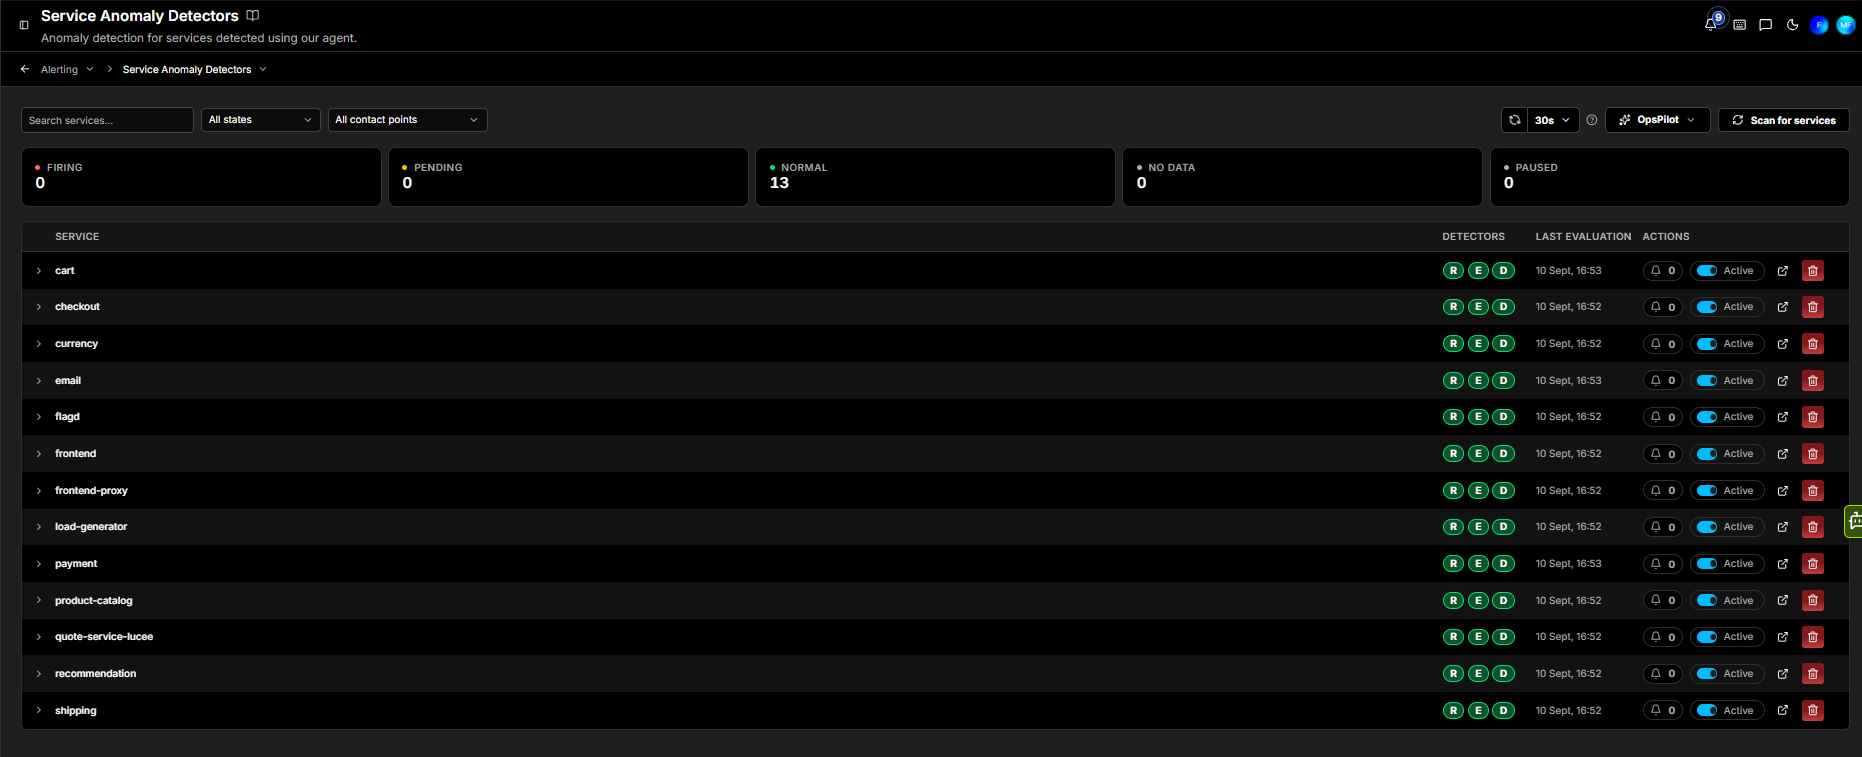
Service detectors are built from your instrumented services using templates. Alerts fire when the anomaly probability stays above the configured threshold for the pending duration.
Each instrumented service automatically gets three detectors, shown as R, E, and D badges in the Detectors column:
- Rate (R) - request rate anomalies
- Error (E) - error rate anomalies
- Latency (D) - response time anomalies (also shown as Duration on the Status page)
Each row in the service list shows the service name, its Detectors (R/E/D), the Last evaluation time, and actions: a notification count, an Active toggle to enable or pause the service's detectors, an Open dashboard button, and a delete button. Expand a row to see and tune the individual detectors.
Scanning for services
Click Scan for services to detect your instrumented services and auto-create detectors for them. If no service detectors exist yet, this is the first step.
State counters
| State | Description |
|---|---|
| Firing | The anomaly condition is currently met |
| Pending | The condition is met but the pending duration has not elapsed |
| Normal | The detector is evaluating and no anomaly is detected |
| No Data | The detector has no data to evaluate |
| Paused | The detector is paused and not evaluating |
Filtering the list
- Search services - find detectors by service name
- All states - filter by current state
- All contact points - filter by the contact point the detector routes to
To the right of the filters sit a refresh button and the auto-refresh interval (such as, 30s).
The OpsPilot dropdown offers AI shortcuts: Explain my detectors, Help me create a detector, and Suggest detectors to add.
Detector settings
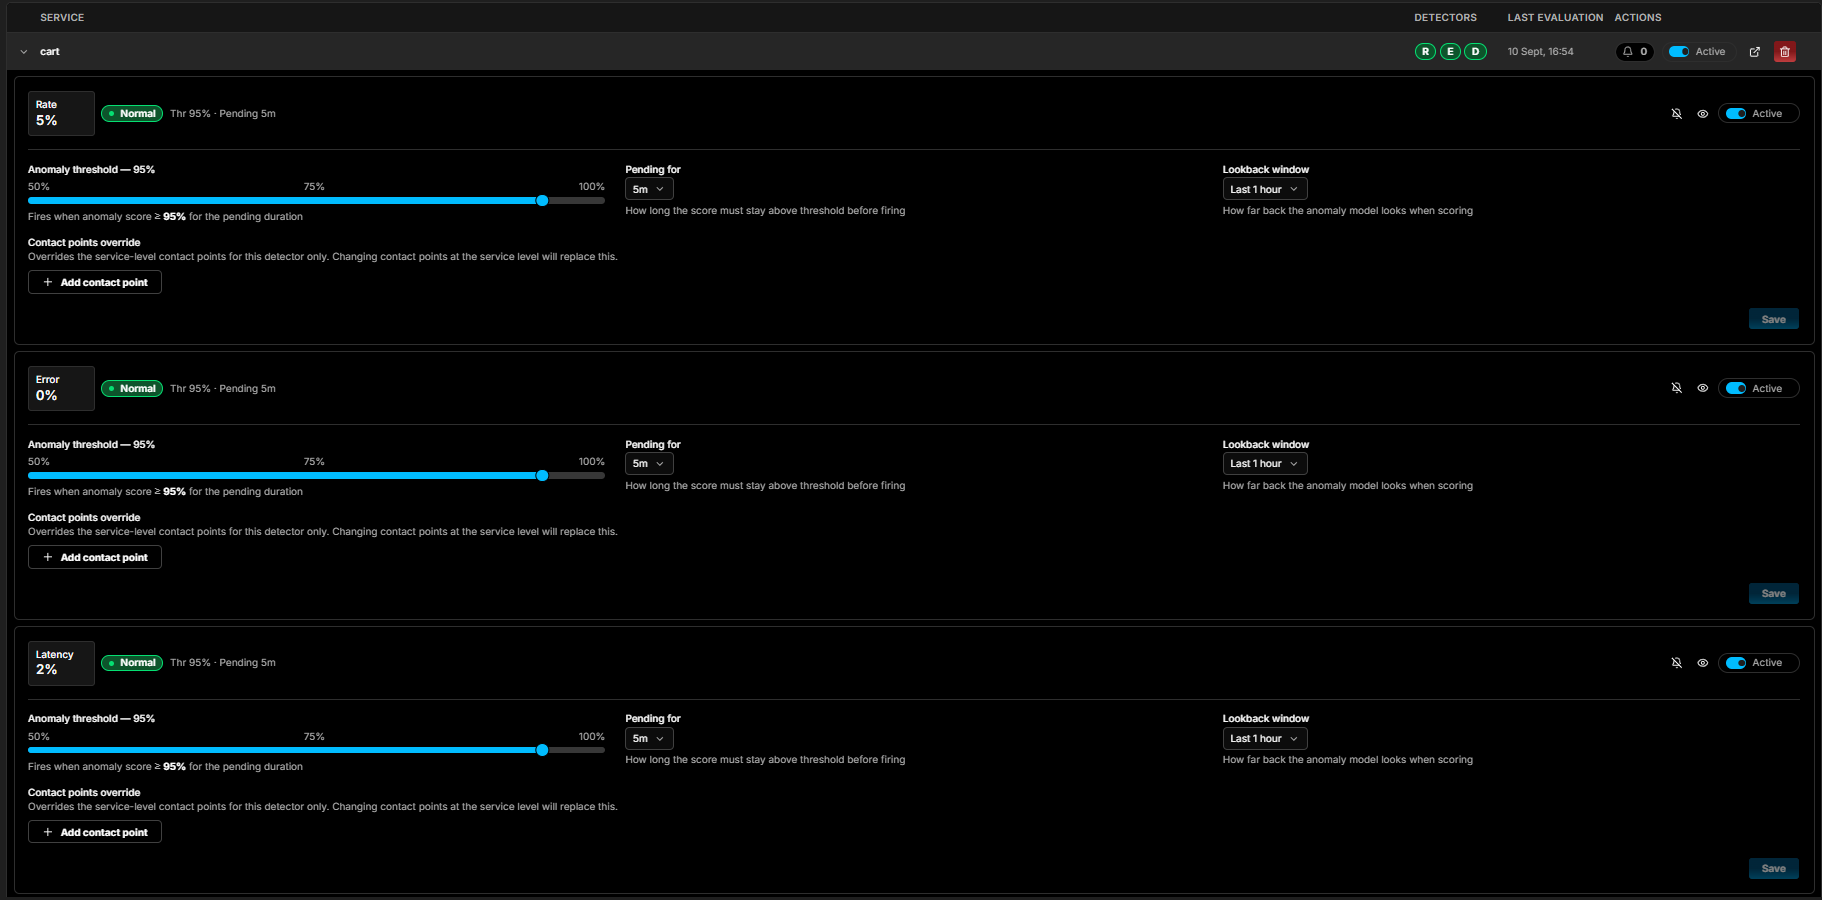
Expand a service row to see and tune its individual detectors. Each detector card shows its current anomaly score and state, with a Thr and Pending summary, plus a mute icon, a view (eye) icon, and an Active toggle. Below that, each detector has these settings:
| Setting | Description |
|---|---|
| Anomaly threshold | The score (50-100%) at or above which the detector fires. Drag the slider - it fires when the anomaly score is at or above the threshold for the pending duration |
| Pending for | How long the score must stay above the threshold before firing (such as, 5m) |
| Lookback window | How far back the anomaly model looks when scoring (such as, Last 1 hour) |
| Contact points override | Overrides the service-level contact points for this detector only - click + Add contact point. Changing contact points at the service level replaces this |
Click Save on a detector to apply its changes.
Learn more
Custom Anomaly Detectors - define detectors against your own PromQL queries