Recording Rules
Recording rules run a query on a schedule and save the result as a new metric. Use them to pre-compute expensive queries, derive metrics from logs, or simplify complex alert conditions into a single metric you can reuse across dashboards and alerts.
Navigate to Alerting > Recording Rules to open it.
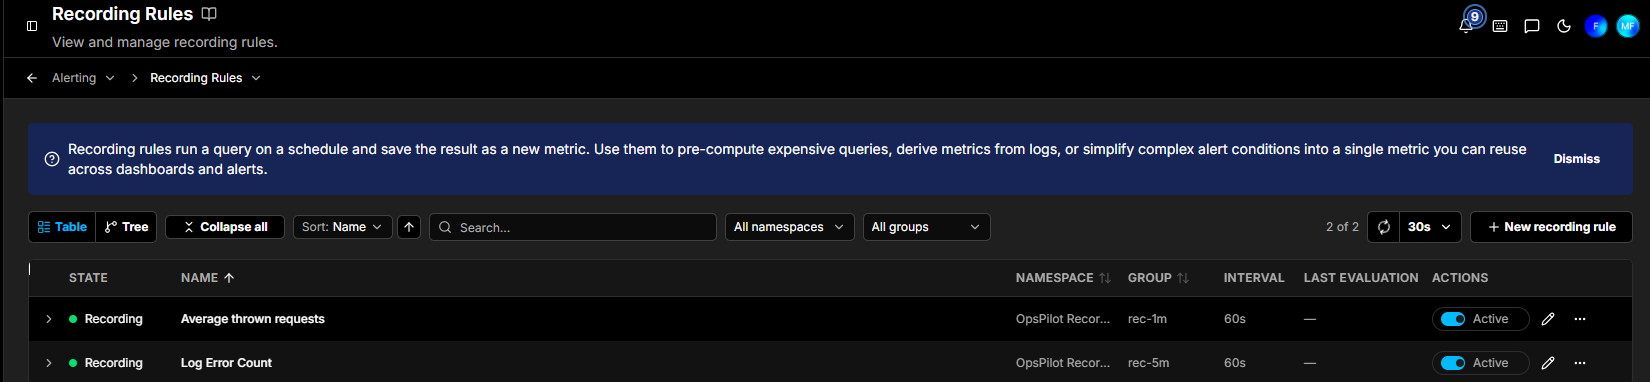
The recording rules list
Switch between Table and Tree views using the toolbar buttons. In Tree view, rules are grouped by namespace and evaluation group; use Expand all and Collapse all to open or fold every group at once.
The right of the toolbar shows how many rules are listed (such as, 2 of 2), alongside a refresh button and the auto-refresh interval (such as, 30s).
The table has the following columns:
| Column | Description |
|---|---|
| State | The rule's state - Recording while it is evaluating and writing its metric |
| Name | The recording rule's name, which is also the name of the metric it produces |
| Namespace | The namespace the rule is stored in |
| Group | The evaluation group the rule belongs to |
| Interval | How often the rule runs (such as, 60s) |
| Last evaluation | When the rule was last evaluated |
| Actions | An Active toggle to enable or pause the rule, an edit button, and a ... menu to Duplicate or Delete the rule |
Sorting and filtering
- Sort - order rules by Name or other fields; toggle ascending/descending with the arrow button
- Search - find rules by name
- Filters - filter by namespace or evaluation group
Creating a recording rule
Click + New recording rule (top right) to open the editor. Like alert rules, it has Quick and Advanced modes (toggled top right).
Quick mode
Quick mode puts the essentials on one page:
| Field | Description |
|---|---|
| Rule name | A human-readable name for the recording rule |
| Metric name | The name of the new metric this rule records |
| Data source | The source to query - Metrics, or Logs to produce a metric from logs (for example, count errors per minute) |
| Expression | The query to evaluate; its result is saved as the metric above. Build it in Builder mode (Record the [aggregation, such as count over time] of logs where [filter], with optional aggregate and filter), or switch to Code to write the query (PromQL or LogQL) directly. A Preview graph shows the recorded metric over a 15m/1h/3h/6h/24h window |
| Evaluation interval | How often the expression is evaluated and the metric recorded (such as, 1m) |
| Namespace | The namespace where the recording rule is stored |
| Labels | Optional labels to attach to the recorded metric - expand the Labels section to add them |
Advanced mode
Advanced mode is a single-page form that exposes the full configuration - a chain of queries and expressions, with one step nominated as the metric to record. Rule name and Metric name sit at the top, as in Quick mode.
What should this rule compute?
Build the rule from a chain of Queries & expressions. Click + Add query (or use its dropdown) to add a step, and give each one a Reference ID (such as $A) that later steps can reference. The step types are the same as for alert rules - for example, a Query step reading up{} from Metrics, a second Query step running count_over_time({level="ERROR"} [1m]) against Logs, a Math step combining them as $B / $A, and a Reduce step applying a Function such as sum.
Record source (at the top of the section) selects which step's result is saved as the metric. That step is highlighted in the chain and marked with a Recording chip.
Reorder steps with the arrows to the left of each one, and remove a step with the ✕ on its right. An Evaluation preview graph below the chain shows the resulting series.
Evaluation interval, namespace, and labels
| Setting | Description |
|---|---|
| Evaluation interval | How often the expression is evaluated and the metric recorded (such as, 1m) |
| Namespace | The namespace where the metric recorder is stored (such as, OpsPilot Recording Rules) |
| Labels | Expand Labels to attach optional labels to the recorded metric |
Click Save (or Save changes when editing) to activate the rule; it begins recording its metric on the next interval. Click Cancel to discard your changes.
Need more help?
Contact support in the chat bubble and let us know how we can assist.